Blog
Deal or no deal?
Deal volume appears to be on the decline in the South Florida residential real estate market. This could be seasonal, but it may also be due to higher rates finally having an impact. The process of interest rate normalization may result in some real estate market changes, so you may want to prepare yourself. Our first chart today shows the annual transaction volume for the Miami-Dade, Broward and Palm Beach County residential market.
Next we have a snapshot of the annual sales numbers for houses and condo properties. As we have noted in previous posts, 2015 was the big year for transaction volume. Deal flow declined in 2016 and 2017. When you look at our chart of rates you will see how borrowing costs moderated in 2015 and 2016.
| Year | Annual Total | Monthly Average |
| 2012 | 86,001 | 7,167 |
| 2013 | 91,180 | 7,598 |
| 2014 | 91,239 | 7,603 |
| 2015 | 96,411 | 8,034 |
| 2016 | 90,974 | 7,581 |
| 2017 | 88,227 | 7,352 |
Deal prices in South Florida
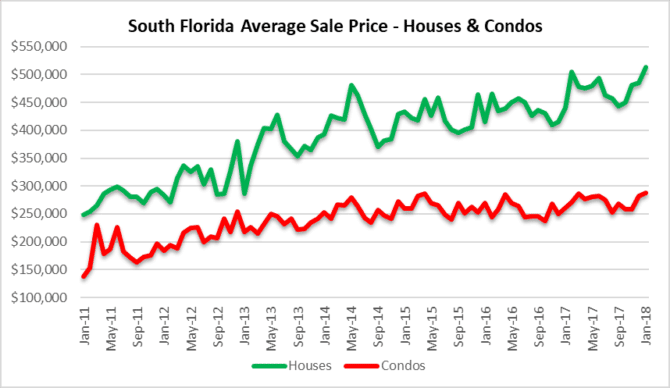
Average sale prices have remained lofty and we will see if the latest rally in mortgage rates begins to take a bite out of prices. During the month of January, the average sale price of a single-family home in South Florida was $513,922 and the average sale price of a condo property was $288,302.
Deal by transaction type – single family homes
The trend in sales for single-family homes looks like it is on the decline in South Florida. During the month of January, residential sales dropped 21% from 3,743 in December to 2,957 in January.
Deal by transaction type – condo properties
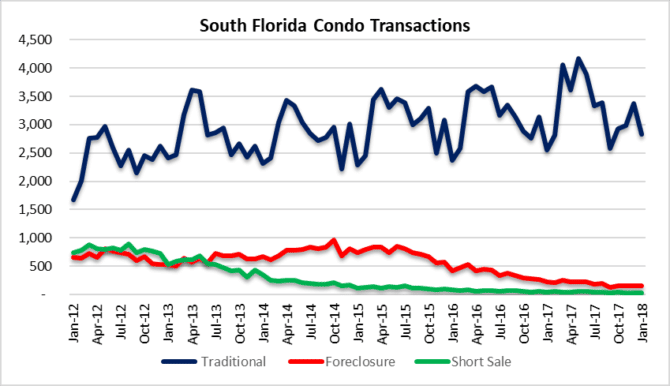
Transaction volume in the condo market declined 15% from 3,567 sales in December to 3,023 in January. You may notice from the chart that the month of January usually has weak volume, so it will be interesting to see if the market rebounds over the next few months.
Deal before rates stun the market
Mortgage rates continue to be the hot topic. The lending environment has been very favorable for almost a decade and that may be changing. This next chart illustrates the past five years of mortgage rates and the ten year bond yield correlation. This week the mortgage market revisited rates that we haven’t seen in nearly five years. The last big move in rates was a result of the taper tantrum back in May of 2013. The impact of this latest move in rates may take a few months to show up in the real estate market, but there is a good chance you are already seeing properties lag on the market and prices decline.
If you are in the market to buy property, an excellent resource for updated rate information is the Freddie Mac website. Freddie Mac They have rates with estimated fees/points and an interactive chart also, so check it out!


