Blog
Fort Lauderdale area real estate market update with prices, inventory & foreclosure activity
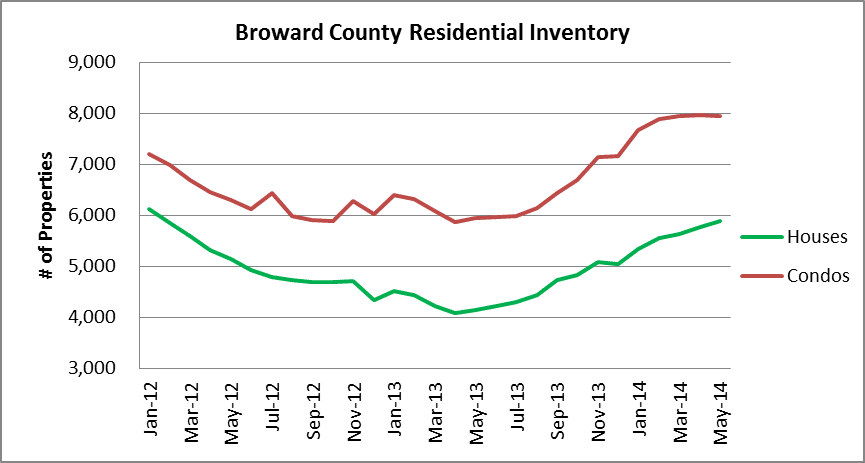
Another month of housing activity is in the books, so now we drop the data into some charts to see what the market looks like. Our first chart is the inventory of houses and condo properties throughout Broward County, Florida. Since April 2013, the residential inventory has climbed 39% and reached a total of 13,839 properties listed for sale in May. It looks like the inventory of condo/townhouse properties has leveled-off a bit at 7,946 in May, but the inventory of single-family homes in Broward appears to continue rising and reached 5,893 last month.
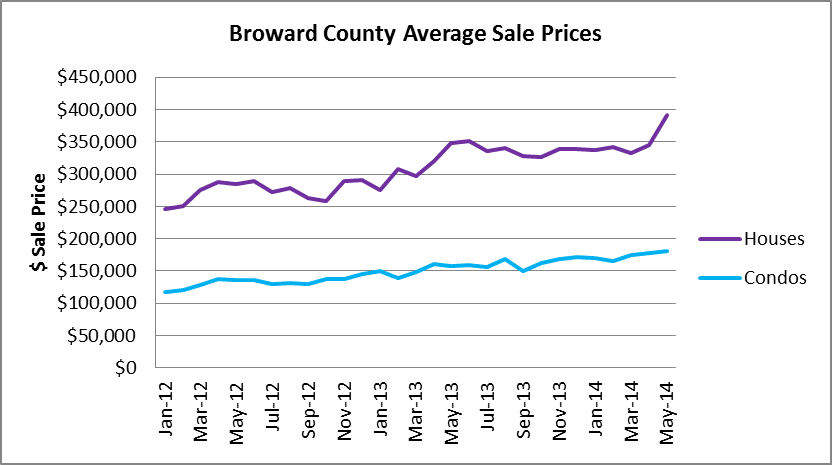
How about the average sale prices? As for single-family homes, the average sale price reached $390,755 in the month of may and the average sale price of a condo/townhouse property rose to $180,522. The jump in house prices was more significant than the rise in condo property prices. Remember that the average sale price tends to be more volatile than the median sale price, so one month of data does not make a trend and a few big ticket sales will sway the averages. In one of our upcoming posts we will take a look at the median sale prices for houses and condos.
Our next chart illustrates the steady pace of new foreclosure filings in Broward County, where there were a total of 2,096 filings in the month of May.
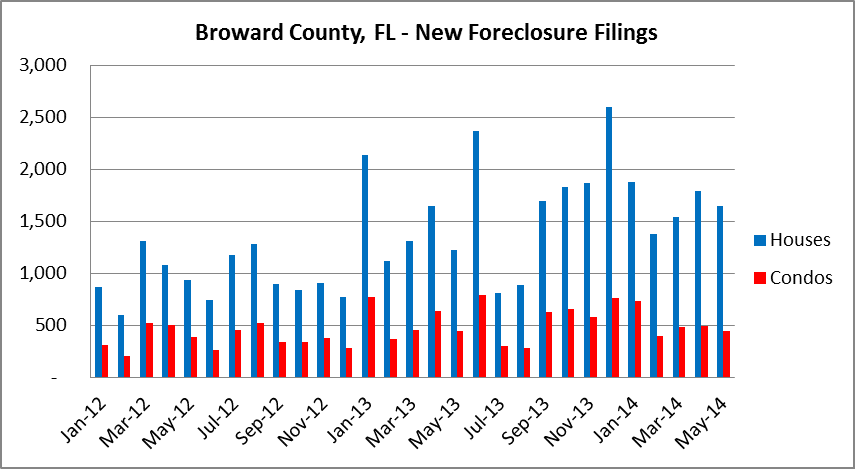
The chart of foreclosure filings clearly shows that the new filings remain elevated. Just to add some additional perspective, this is how the annual averages stack-up:
- In 2012 the monthly average of foreclosure filings was 1,332
- In 2013 the monthly average of foreclosure filings was 2,182
- So far through 2014, the monthly average of foreclosure filings is 2,161
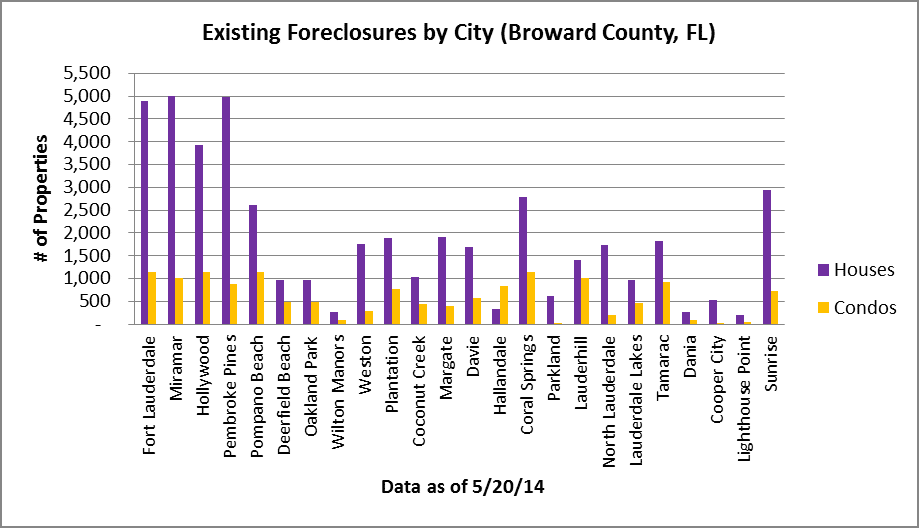
If all of these properties were somehow making it to the market and getting in the hands of people who will pay the mortgage, that would be great. However, that doesn’t seem to be the case when we look at this next chart of roughly 60,000 properties in the foreclosure process throughout Broward County, Florida. As always, feel free to click on the chart to enlarge.
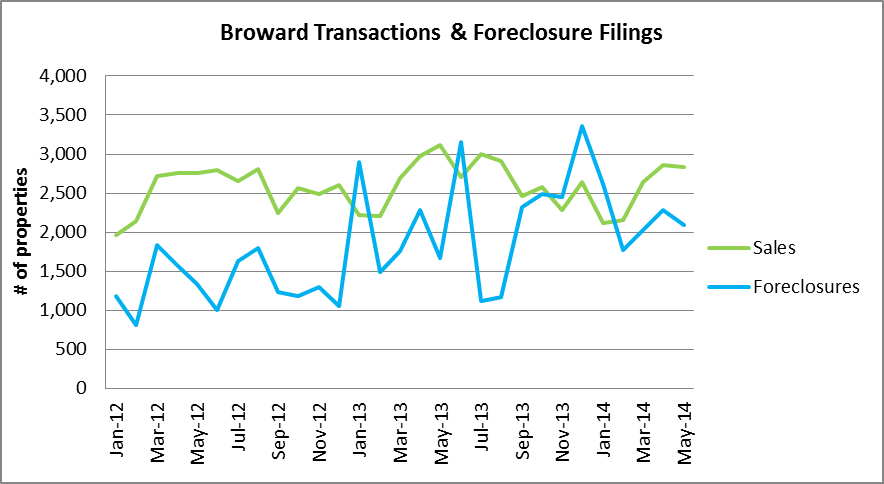
How about the pace of transaction closings as compared to foreclosure filings? Take a look at this next chart of all the sales closing, compared to the pace of foreclosure filings. In an upcoming post we will show the distresses sales compared to foreclosure filings and you will see how lopsided the numbers are. The total number of distressed sales are a mere fraction of the new foreclosure filings and that is one of the reasons why we cannot clear all of the properties in foreclosure.
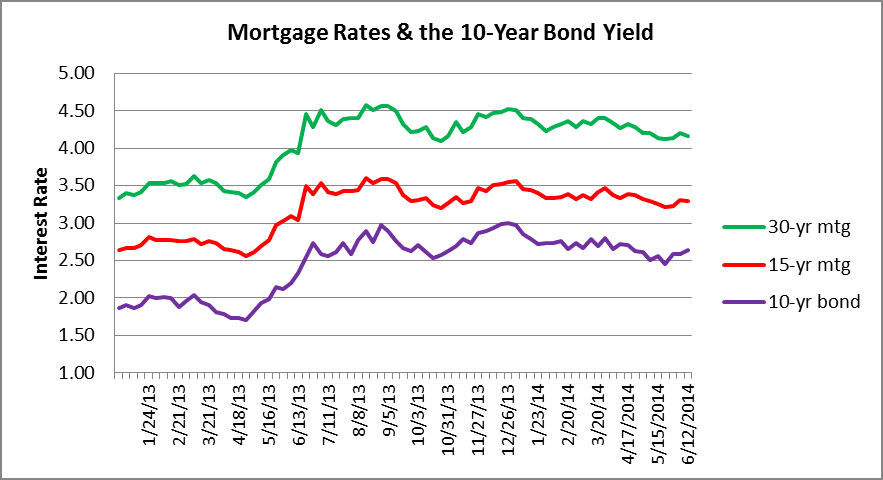
How about mortgage rates? They are still very low and have been facilitating the recent price rally. A good benchmark to keep your eyes on is the 10-year bond rate. When the 10-year gets above 3.00%, the housing market will slow, but that shouldn’t happen anytime soon. If you look at the rate increase one year ago (May 2013), then look back to the average sale price chart above, the impact becomes apparent. Rates should remain low throughout the summer and may gradually climb by the end of the year, barring any drastic change in Fed policy. That doesn’t appear to be likely, as the Fed seems complacent keeping rates artificially low and creating new bubbles across all asset classes. Enjoy it while it lasts!