Blog
Taking a look at the Fort Lauderdale foreclosure market
It has been awhile since we have provided a foreclosure update with a city by city count of properties. Today we will run through Broward County. Our first chart shows how each city stacks up. Although many of these properties will not make it to the market, there are 5,911 houses and condos in some stage of foreclosure scattered across the area. Fort Lauderdale, Miramar, Hollywood and Pompano Beach lead the list.

Foreclosure count by city
Here is a look at how many houses and condo properties currently have a mortgage foreclosure filing on them in Fort Lauderdale and the surrounding areas as of our latest count on March 11, 2018:
| Houses | Condos | ||
| Fort Lauderdale | 525 | 84 | |
| Miramar | 690 | 61 | |
| Hollywood | 353 | 101 | |
| Pembroke Pines | 501 | 46 | |
| Pompano Beach | 265 | 72 | |
| Deerfield Beach | 81 | 31 | |
| Oakland Park | 96 | 36 | |
| Wilton Manors | 32 | 4 | |
| Weston | 166 | 24 | |
| Plantation | 193 | 60 | |
| Coconut Creek | 110 | 39 | |
| Margate | 194 | 33 | |
| Davie | 142 | 41 | |
| Hallandale Beach | 37 | 60 | |
| Coral Springs | 294 | 69 | |
| Parkland | 73 | 1 | |
| Lauderhill | 185 | 134 | |
| North Lauderdale | 180 | 13 | |
| Lauderdale Lakes | 97 | 49 | |
| Tamarac | 147 | 73 | |
| Dania | 23 | 8 | |
| Cooper City | 83 | – | |
| Lighthouse Point | 19 | 2 | |
| Sunrise | 314 | 70 | |
| Total | 4,800 | 1,111 | |
Monthly foreclosure filings in Broward County
The pace of new mortgage foreclosure filings took a break during the fourth quarter of 2017 due to the FEMA hold on filings. New filings have been slow to start 2018, but we expect them to move higher as we move through 2018.

Here is a quick look at the number of annual filings in Broward County and the monthly averages going back to 2015:
| Annual | Monthly | Change | |
| 2015 | 3,356 | 280 | |
| 2016 | 5,044 | 420 | 50% |
| 2017 | 5,228 | 436 | 4% |
| 2018 (Jan,Feb) | 508 | 254 | -42% |
How does Broward County compare to Miami-Dade and Palm Beach? Take a look at this next chart. The sharp decline across the tri-county area took place in September after Hurricane Irma. We don’t know how long it will take to resume the prior pace, but stay tuned and we will continue to provide updates.

Delinquency rate – national
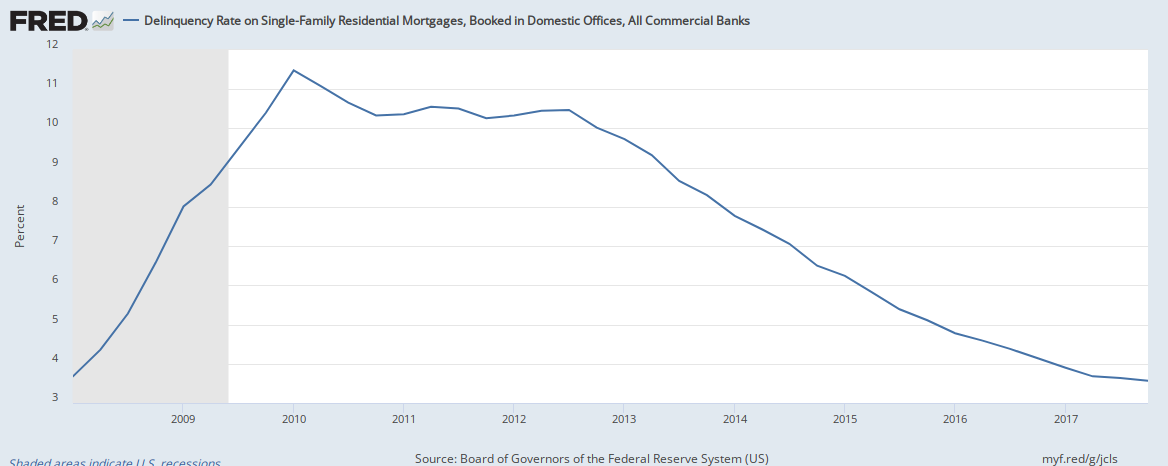
Here is a great FRED chart (St. Louis FED) showing the national mortgage delinquency rate back to the financial crisis and through the end of 2017. South Florida is a different animal than the national snapshot and we continue to wrestle with foreclosures long after the crisis. Mortgage Delinquency – National