Blog
Headline of the day
The headline of the day appeared after existing home sales tanked for December. Here is a good link. Apparently real estate agents were “baffled” by the latest home sales report. How could this happen? You mean that real estate doesn’t always go up? If agents would spend some time doing basic math and affordability analysis, they would hopefully recognize that prices haven’t made sense in years. What’s frightening is that they ignore all of the signs of a slowdown and their clients get stuck holding the bag. Let’s take a look at a few charts of the South Florida market:
Average sale price
I saw a brief news segment on how all the rich people in New York are buying mansions in South Florida. Not according to the average sale prices. They have flat-lined and it looks like the next move is lower. In addition, a few large transactions tend to distort the data, so don’t believe everything you hear. We still believe that the South Florida residential market peaked in June 2018. Since then, the average sale price of a house has declined 10% and condo prices have declined 14%. Is that booming or collapsing?

Residential Inventory
The number of houses and condos listed for sale dipped slightly in December, but that is typically seasonal as people take their properties off the market during the holidays. In December there were 50,167 properties on the market, down from 51,256 in November. The number of residential listings should snap back in January.

Transaction volume
There was a total of 6,647 residential sales closed in December. These numbers include houses and condos in Miami, Fort Lauderdale and Palm beach areas. That number is down slightly from 6,711 in November, but down a whopping 27% from the 9,141 closings back in June 2018 when the market peaked.
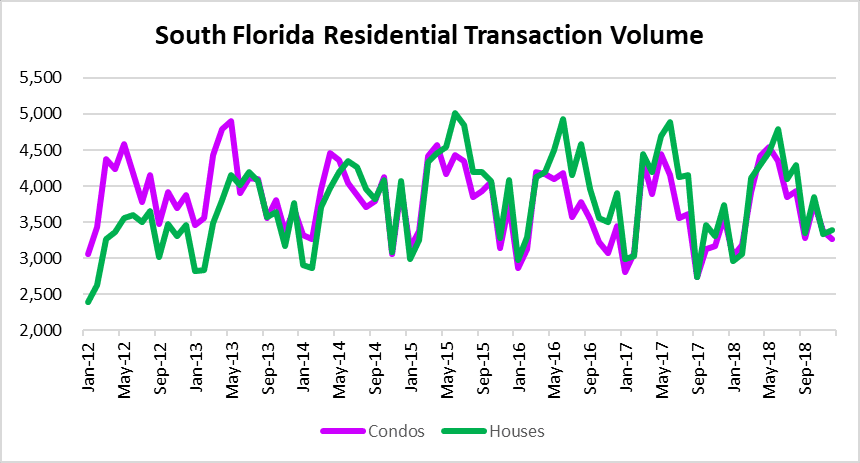
As for the 2018 summary, the numbers fared pretty well compared to the last few years. The 2018 monthly average of transactions in South Florida climbed 3% over 2017. You can see from the chart below that 2015 was the big winner. Although transaction volume ended the year o.k., we will continue to monitor the numbers as this latest housing bubble may be leaking air. After nearly a decade of record low interest rates, bailouts and foreclosure moratoriums, the real estate market will eventually have to pay the piper.
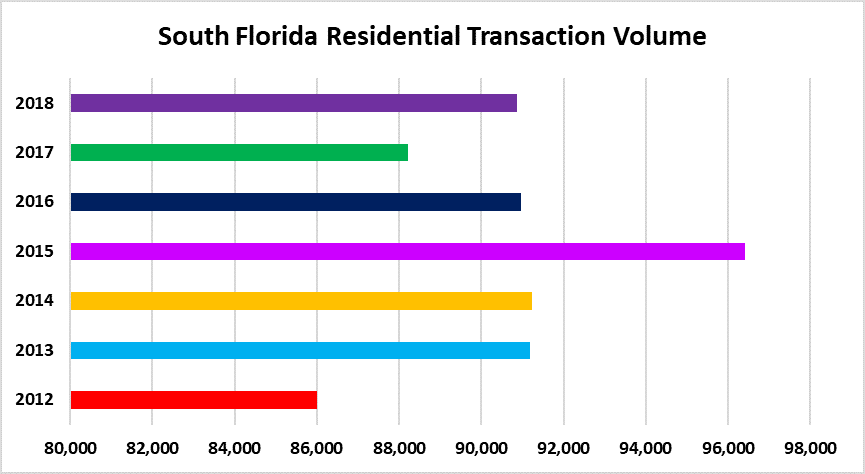
| Annual | Monthly Avg | |
| 2012 | 86,001 | 7,167 |
| 2013 | 91,180 | 7,598 |
| 2014 | 91,239 | 7,603 |
| 2015 | 96,411 | 8,034 |
| 2016 | 90,974 | 7,581 |
| 2017 | 88,227 | 7,352 |
| 2018 | 90,870 | 7,573 |