Blog
Market pulse – South Florida real estate deal volume, inventory, prices & distressed property update
It’s time to check the market pulse in South Florida real estate. Today we are going to look at a few charts including deal volume, available inventory, median sale prices and a few good snapshots of the distressed property market.
Market Pulse – Deal Volume
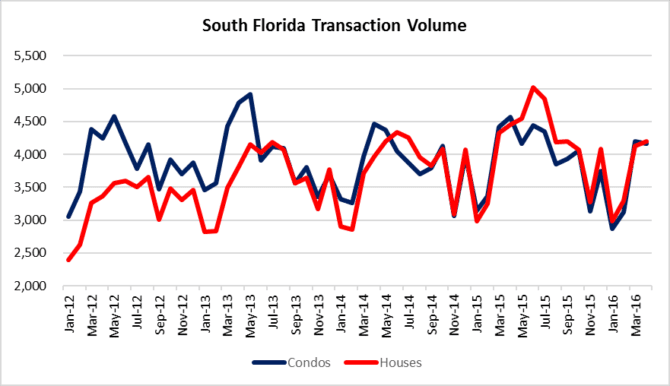
A few months ago were were afraid that deal volume was collapsing, but it appears to have bounced back. During the month of April there were 8,364 closed sales. That is a nice increase from the low of 5,849 deals in January, but still 12% lower from the high of 9,453 when we believe the market peaked last June. In 2015 the monthly average of closed sales was 8,034 and so far through 2016 the average has dropped 10% to 7,240.
Market Pulse – Available Inventory
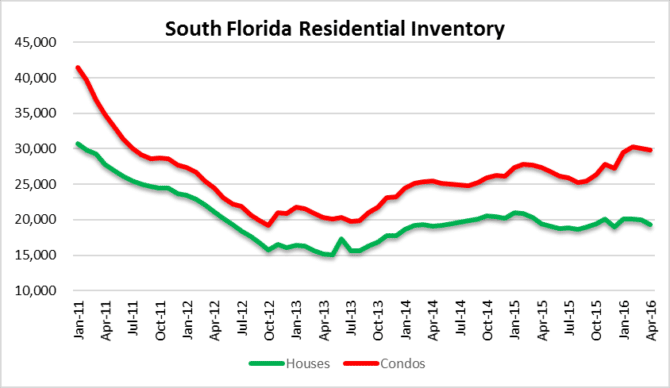
There were 49,188 residential properties (houses & condos) available on the market in the month of April, down from 50,094 in March. Condo inventory dipped slightly to 29,817 units on the market and there were 19,371 houses listed for sale.
Median Sale Prices – Houses
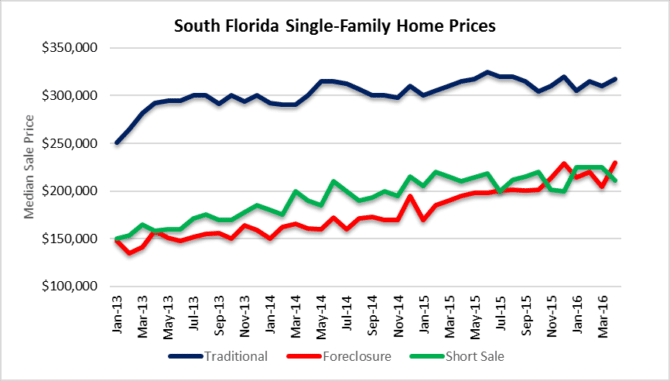
Prices of single-family homes have remained stable, but we wanted to highlight the gradual monthly climb in foreclosure prices. From the beginning of the chart in January 2013, foreclosure prices have climbed a whopping 56%, while traditional sales have only climbed 26% and short sales rose 41%. In April, the median sale prices for houses were as follows:
- Traditional sales- $317,000 up from $310,000 in March
- Foreclosure sales – $230,000 up from $204,336 in March
- Short sales – $211,000 down from $225,000 in March
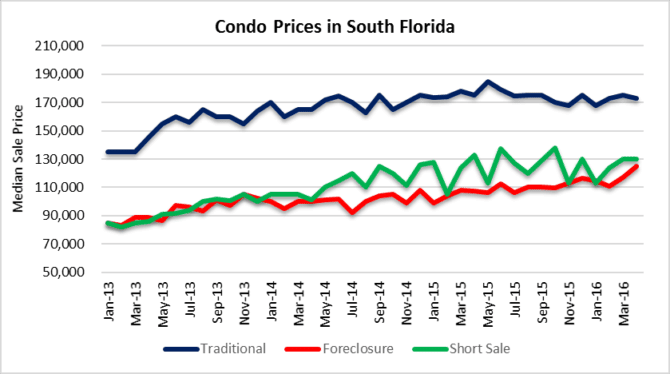
Median Sale Prices – Condos
When we look at condo prices, foreclosure prices have climbed 47% and short sale prices have climbed 53% since January 2013. For the same period, traditional sale prices for condos have only climbed 26%. here are the median sale prices for April:
- Traditional sales – $173,000 down from $175,000 in March
- Foreclosure sales – $25,000 up from $116,765 in March
- Short sales- $130,000 unchanged from March
Market Pulse – Monthly Foreclosure Filings
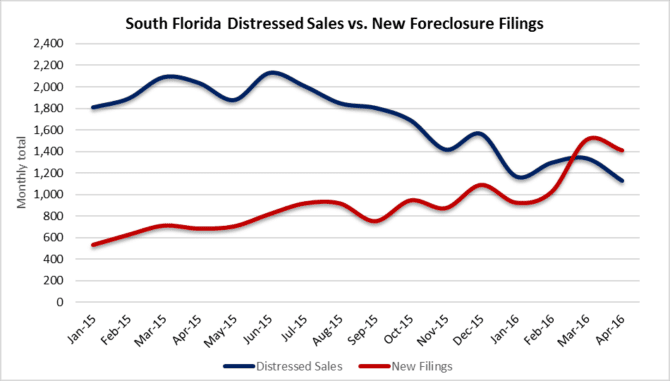
There has been a 54% increase in the monthly average of foreclosure filings in 2016. last year the monthly average was 796 and this year it has already jumped to 1,230. This chart is certainly worth watching because it sure looks like the trend is moving upward for this market.
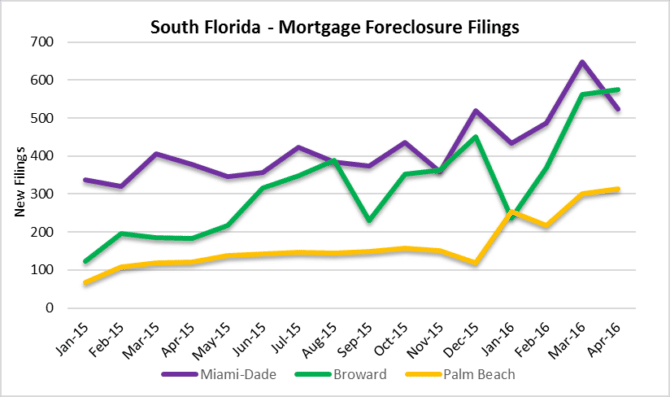
Chart o’ the day – Distressed Sales and Foreclosure Filings
Last but not least, here is a look at the trend of new foreclosure filings compared to distressed sales. Look at the large divergence in early 2015 and now the lines have crossed. In most charts this pattern would be labeled a “death cross” and not for a good reason. Basically, if the number of new foreclosure filings remains above the number of distressed sales for too long, you will see the already massive shadow inventory of foreclosures grow even larger. No bueno!