Blog
Mortgage foreclosure filings in South Florida
As we expected, mortgage foreclosure filings are ramping-up once again. They were gaining momentum throughout 2017 until Hurricane Irma, when FEMA placed a 90-day hold on foreclosure filings. That led to the annual “holiday hold”, so it looks like the banks are getting back in inaction. Many of these cases have been lingering since the 2008 financial crisis. Thanks to the failed mortgage bailout programs (too many to list) and the innate ability of South Floridians to game the judicial foreclosure system, we continue to wrestle with this problem. Let’s take a look at the overall picture of monthly filings that have been recorded as of April 4th, 2018. As always, we will update the data if it changes.

Mortgage foreclosure filings in Miami-Dade
New filings throughout Miami-Dade County appear to be making a strong comeback and gaining momentum as we move through 2018.

Here is a look at the annual numbers and monthly averages in Miami:
| Annual | Monthly | Change | |
| 2015 | 4,638 | 387 | |
| 2016 | 6,855 | 571 | 48% |
| 2017 | 5,393 | 449 | -21% |
| 2018 | 1,403 | 468 | 4% |
Mortgage foreclosure filings in Broward County / Greater Fort Lauderdale area
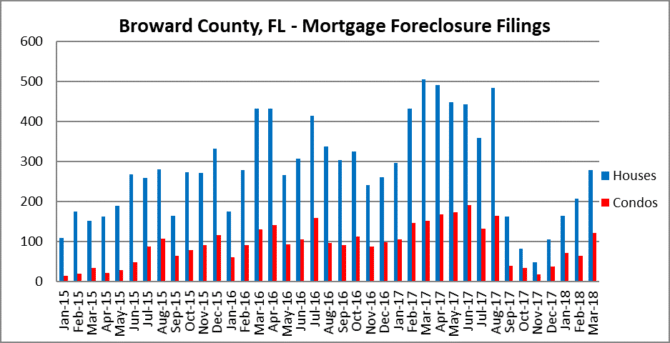
Here is a snapshot of the annual and monthly numbers for Broward County Florida:
| Annual | Monthly | Change | |
| 2015 | 3,356 | 280 | |
| 2016 | 5,044 | 420 | 50% |
| 2017 | 5,228 | 436 | 4% |
| 2018 | 908 | 303 | -31% |
Moving on North to Palm Beach County
Filings continue to climb up in Palm Beach County also as we move into the second quarter of 2018.

And for the summary of annual and monthly averages in Palm Beach:
| Annual | Monthly | Change | |
| 2015 | 1,706 | 142 | |
| 2016 | 3,295 | 275 | 93% |
| 2017 | 2,450 | 204 | -26% |
| 2018 | 545 | 182 | 44% |
The South Florida residential real estate market may have reflated after the crisis, but it has not fully recovered. There are still thousands of houses and condos in the “shadow inventory” that may eventually hit the market. In addition, property owners may be using their homes as ATM’s once again. Here is a link to a recent article about home equity posted on CNBC.com: Home Equity article