Blog
Plotting the next move
When will it be time to begin plotting your next move? It sure seems like real estate markets have been defying all logic and the charts have showed some resilience so far throughout 2017. At some point the rally across all asset classes will run out of steam, whether we see it first in stocks, bonds or real estate will be the question.
Plotting average sale prices in South Florida
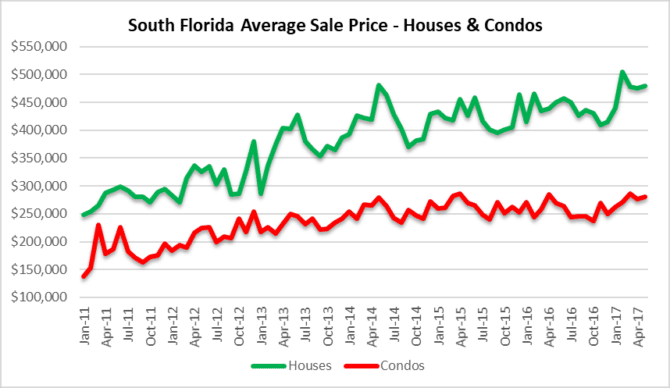
After seeing a multi-year high price of $505,236 during the month of February, it appears that single-family home prices may be taking a breather in South Florida. During the month of May, prices slipped 5% from the February highs to $480,133. The question is whether they continue the slide over the summer or make an attempt at another high. At first glance, we may have already seen the cycle peak in single-family home prices in this market. As for the average selling price of condos, they appear to have made their 2017 high during the month of March at $286,474 and dipped slightly (4%) to $280,096 in May. It is noteworthy that condo prices have failed to surpass the $300,000 mark and repeatedly meet resistance at that level. If condo prices are failing to reach new highs with all of this accommodation, there is a good chance their next move is downward.
Plotting the Peaks and Valleys in Transaction Volume
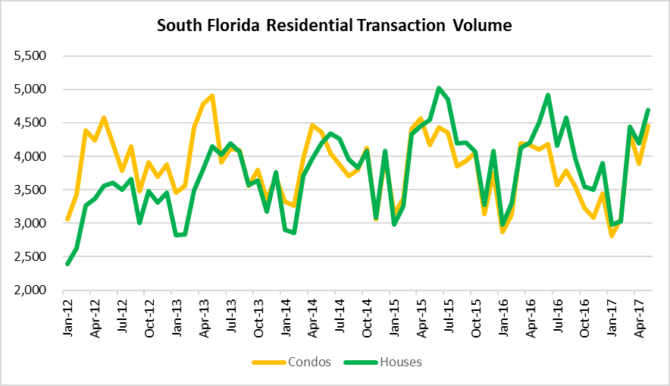
As for transaction volume, South Florida has seen some peaks and valleys. January saw a seasonal drop to 5,794 residential transactions, but deal volume has rebounded nicely to 9,141 closed transactions in May. The month of June has been strong for the past few years, so we shall see if we reach the previous highs next month. A failure to reach previous highs in deal volume will most-likely lead to a downtrend throughout the summer and lower prices across the board.
Residential Inventory
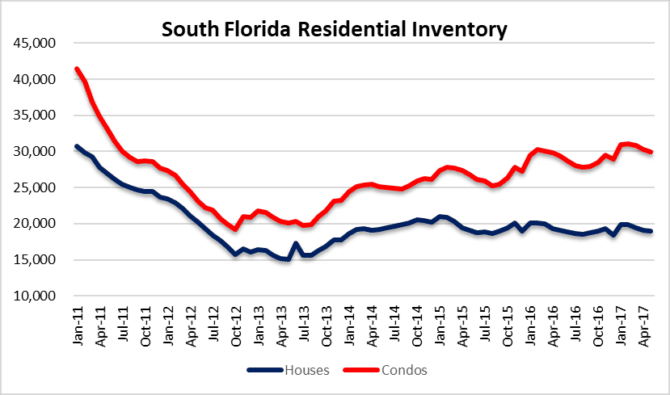
As long as we don’t include the massive shadow inventory of new construction condos, the existing inventory of available properties looks o.k.. As of May, there were 18,937 houses and 29,922 condo / townhouse properties listed for sale in Miami-Dade, Broward and Palm Beach County Florida. If you compare these numbers to 2011 it seems like the current levels remain healthy for now. Remember that the far left of this chart shows when the major banks removed all of their foreclosure inventory from the market because of pending litigation. Believe it or not, many of those properties are still lingering in default and may return to the market.
We have discussed at length how keeping interest rates at crisis level lows for so long will eventually damage a market. A low cost of borrowing encourages buyers to pile on debt and overpay for assets. Since there is an inverse relationship between interest rates and asset prices, the question remains of who will be the bag holders when rates eventually climb and asset prices drop? We all know how that story ends, and apparently repeats itself. Stay tuned.