Blog
A quick look at residential sales, inventory & monthly foreclosure activity in the Greater Fort Lauderdale market
Today we will be taking a look at a few charts including residential sales, inventory and foreclosures in the Greater Fort Lauderdale / Broward County area. The first shows the average sale prices of single-family homes and condo/townhouse properties. In the month of June, the average sale price of a house in Broward County dropped slightly to $365,312, down from $390,755 in the month of May. The average sale price of a condo/townhouse in the area rose to $190,816, up from $180,522 in May.
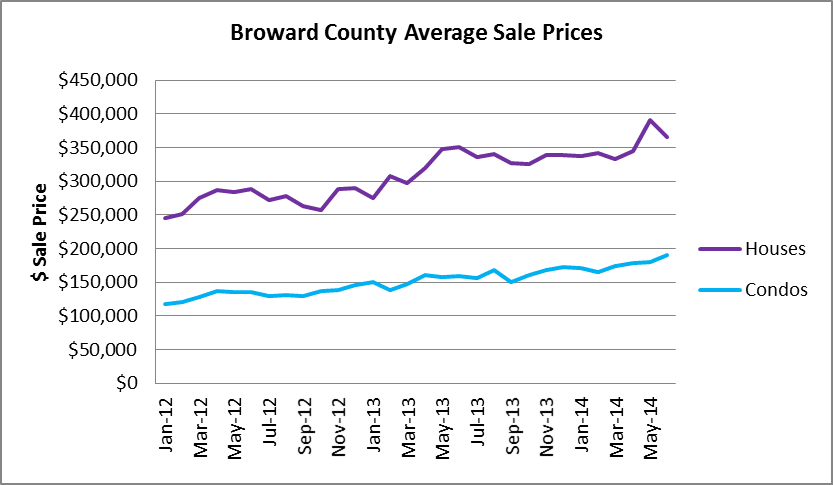
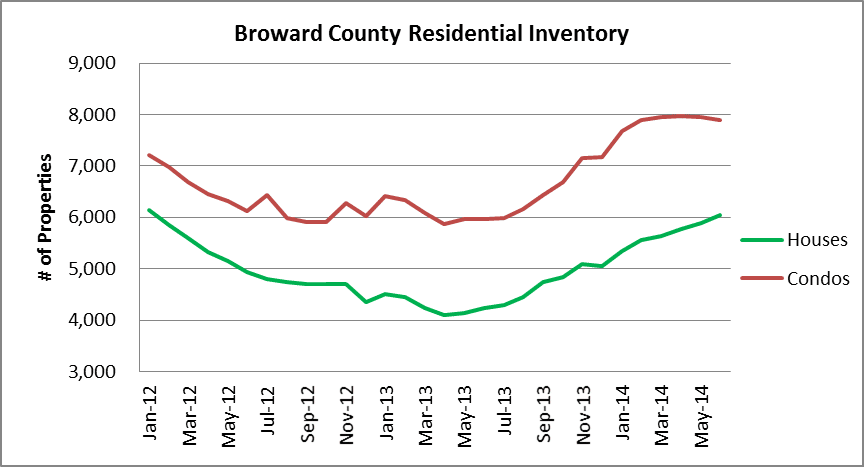
As for the available inventory, the total number of residential properties climbed slightly to 13,943 properties on the market in June, up from 13,839 in May. The listed inventory of condo/townhouse properties has leveled-off at 7,899 units in June and the number of houses on the market rose to 6,044. Take a look at the chart of sale prices above and you will notice the drop in house prices last month. As inventory climbs, the buyers will begin to regain some leverage in the market.
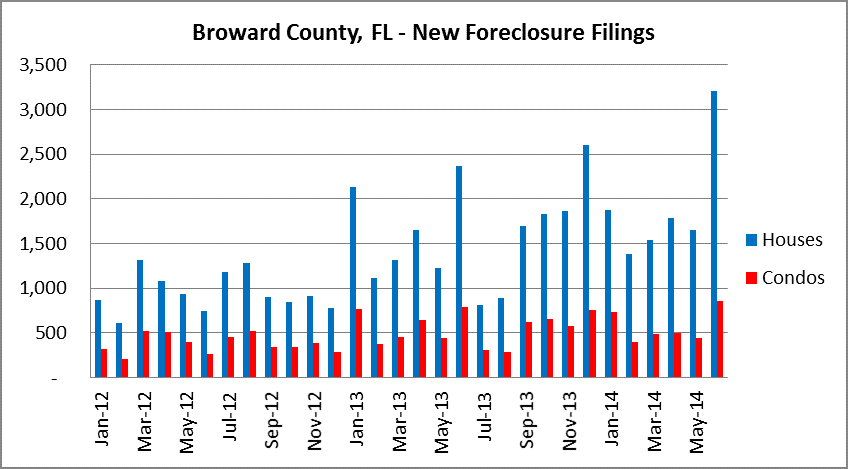
As for foreclosure activity, there was plenty of it in the month of June. There were a total of 4,059 new foreclosure actions in Broward County during the month of June. That is nearly twice as many as the 2,096 filings in May. Here is how the averages look during the “housing recovery” over the past few years:
- In 2012, the monthly average of new foreclosure filings was 1,332
- In 2013, the monthly average climbed 64% over the previous year and was 2,182
- So far in 2014, the monthly average has increased 14% over 2013 and has reached 2,477