Blog
Residential charts & analysis for the tri-county area: Miami-Dade, Broward & Palm Beach, FL
Now that we have all of the data from 2013 in the books, let’s take a look at what has been transpiring in the South Florida residential real estate market. Our first chart today is the available inventory listed for sale.
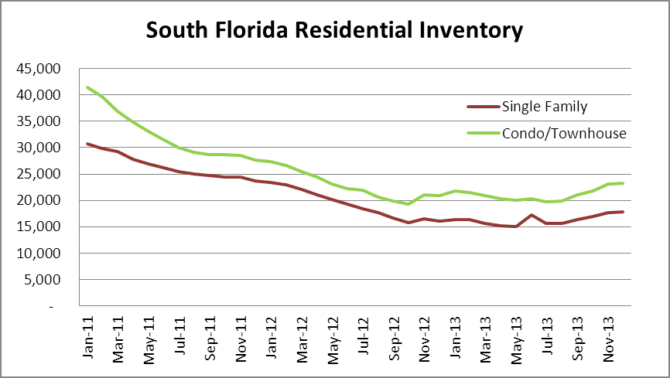
In December, there 17,748 houses and 23,239 condo/townhouse properties listed for sale in the tri-county area, for a total of 40,987 properties on the market. Now take a look at the far left side of the chart above to January 2011 when there were 72,241 total residential properties listed for sale. That is just after foreclosures were halted (October 2010) due to the robo-signing litigation against the banks. In January 2011, there were 30,768 houses and 41,473 condo/townhouse properties available on the market. Once all of the foreclosures were removed from inventory, you will see the gradual decrease over the next 18 months, followed by a stagnant period of almost a year. Finally in June of 2013, inventory started to grow again, once there was some price stability and banks started to foreclose again since most of the litigation is behind them.
As for prices, here is a look at the single-family and condo/townhouse average sale prices.
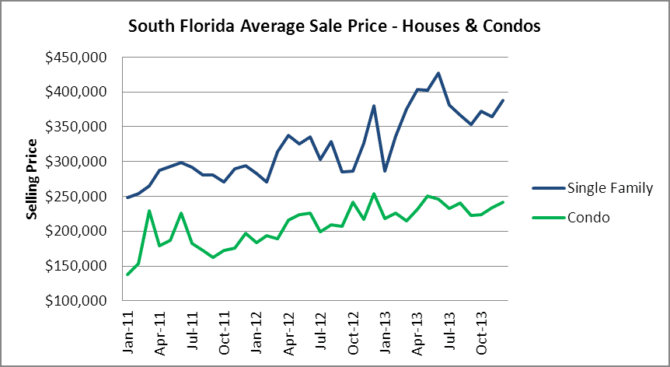
Both segments of the market finished 2013 on an uptick, with the average sale price of houses at $387,365 and condo/townhouse sale prices averaged $241,545.
What types of deals are closing? Here is a look at the single family home transaction types.
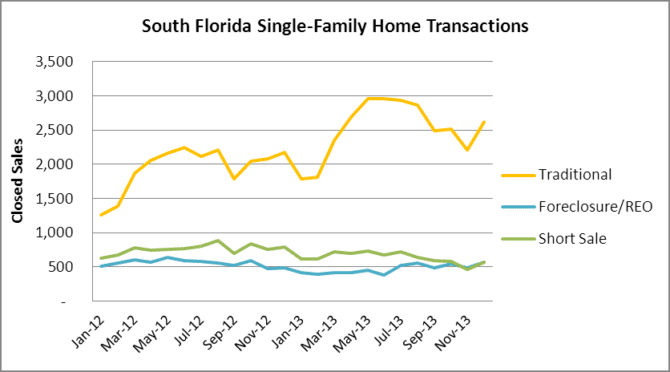
There were 3,765 total closings in the single family segment in December, and here is the breakdown:
- 2,623 traditional sales which accounted for 70% of all closings
- 567 foreclosure/REO transactions which made up 15% of all closings
- 575 short sale transactions which made up the last 15% of all closings
There was a 23% increase in short sale transactions in December over the previous month as many sellers hurried to close their short sales before the Mortgage Forgiveness Debt Relief Act expired at the end of the year.
Now for the condo/townhouse property closings.

In December, there were 3,687 total closings with the following breakdown:
- 2,622 traditional sales which accounted for 71% of all closings for the month
- 627 foreclosure/ REO transactions made up 17% of all closings
- 438 short sales which accounted for 12% of all closings
Once again there was an increase in short sales for this segment as well. Condo/townhouse short sales increases 41% over November closings, most likely due to the expiration of the Mortgage Forgiveness Debt Relief Act.
Next, we will look at the pace of new foreclosure filings. It looks like Miami-Dade and Palm Beach County took a break in December, while Broward hit a new multi-year high in monthly filings.

When we combine all three counties, here is what the numbers look like:
- 82,327 new residential foreclosure filings in 2013, up from 48,633 in 2012 (69% increase)
- 6,861 monthly average of new filings in 2013, up from 4,053 monthly average in 2012
Within a few weeks we will see if Miami-Dade and Palm Beach resume the active pace of new foreclosure filings that we are seeing in Broward. Given the current shadow inventory of foreclosures illustrated in this last chart, it will take several years to work off this massive inventory of distressed properties.
