Blog
Reading beyond the headlines in the South Florida property market
It is often very difficult to get an accurate assessment of the local real estate market. The newspapers and various trade groups almost always attempt spin the data to provide support and confidence to the market even when it is in decline. We believe that the current debt cycle has matured and the South Florida real estate market will begin to wrestle with the negative impact of keeping interest rates too low for too long. Whenever you flood markets with excessive, low-cost debt for an extended period of time, asset prices may get reflated temporarily, but you will eventually have to pay the piper. People often get so excited in a rising market that they fail to look at the fundamentals or lack thereof. Let’s take a look at a few charts of the South Florida market:
Average Sale Price in South Florida
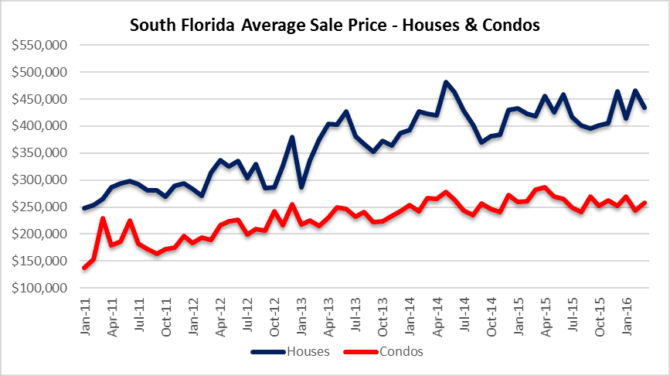
Our first chart today looks at the average sale prices of houses and condo properties in Miami-Dade, Broward and Palm beach County, Florida. During the month of March, the average selling price of a single-family home in South Florida declined 7% from February to $434,683. The average selling price of condo properties actually rose 5% to $257,749. Keep in mind that a few multi-million dollar transactions can move the average prices, so we stress that one month in either direction does not make a trend. We usually take several months of data to determine the direction of the market.
Available Inventory in South Florida
The listed inventory of houses and condos declined in March and that helps buffer any price drops for now. Anytime you see inventory grow for several months, it’s a safe bet that prices will gradually decline. It’s the simple economics law of supply and demand.
- Listed inventory of houses dropped by 136 from 20,132 in February to 19,996 houses on the market in March
- Listed inventory of condos dropped 134 units from 30,232 in February to 30,098 condos on the market in March

Transaction Volume
The fact that transaction volume rebounded in March and snapped the downtrend is a positive sign. We have noted in previous posts that a few months of declining deal volume will accelerate price declines, so it looks like properties caught a bid last month and kept inventory from growing. You will notice that transaction volume still hasn’t regained the levels reached last spring and they probably won’t see those levels anytime soon.
- There were 1,440 closed transaction on houses in March, representing a 39% jump from February
- There were 1,628 closed transaction on condo properties in March, representing a 42% jump from February
- The total of 3,068 closings is a nice rebound from the downtrend, but is still 7% lower than the 3,301 closings last June when we believe the market peaked

New Foreclosure Filings
The recent climb in new foreclosure filings in South Florida is a disturbing development. Most people thought this issue was behind us, but we have discussed that South Florida has a large amount of distressed properties. Some of these properties had suits filed (lis pendens) back in 2008-2010. Many of those initial filings were tossed from court in late 2010 due to the nationwide robo-signing litigation. A combination of frivolous litigation and modification programs that were destined to fail provided a safety net for the real estate market. Now, six to eight years later years later some of the same distressed properties are coming back just like boomerangs. Here are the numbers with the month over month change:
- Miami-Dade County mortgage foreclosure filings increased 33% to 647 in March. The 2016 monthly average is up 35% from last year.
- Broward County mortgage foreclosure filings increased 52% to 563 in March. The 2016 monthly average is up 39% from last year.
- Palm Beach County mortgage foreclosure filings increased 38% to 301 in March. The 2016 monthly average is up 81% from last year.

Foreclosure Filings compared to distressed sales
Another interesting metric that we monitor is the pace of new foreclosure filings compared to the pace of short sales and foreclosure sales. Given the large overhang of distressed properties in South Florida, you obviously want the pace of new foreclosure filings to stay below the pace of distressed sales. For the first time in awhile, we saw the level of new foreclosure filings (1.511) outpace the combined short sale and REO transactions (1,339). Although there is a very long timeline (over 1,000 days) for foreclosures to progress through the courts in Florida, this is not a good indicator. So if you think that distressed properties are a thing of the past in South Florida, think again!
