Blog
South Florida residential market analysis with fun charts & data
It’s time again for our tri-county tour through the condo & single-family home market in Miami-Dade, Broward and Palm Beach County. First things first, let’s look at the pace of the new foreclosure filings in the area:
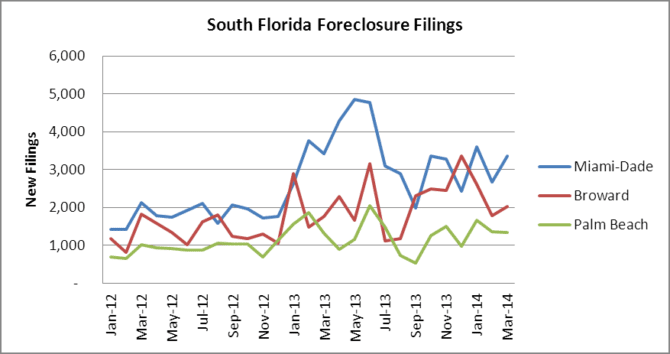
Looking at the averages, here is the summary:
- In 2012, the monthly average of new foreclosure filings was 4,053
- In 2013, the monthly average of new foreclosure filings was 6,861
- Through March of 2014, the monthly average of new foreclosure filings is 6,813
What are the median sale prices looking like? Here is a snapshot of the single-family home prices and they appear to have stagnated in the past few months.

- Median price of a traditional sale was $291,000 in February
- Median price of a foreclosure sale was $162,000 in February
- Median price of a short sale was $175,000 in February
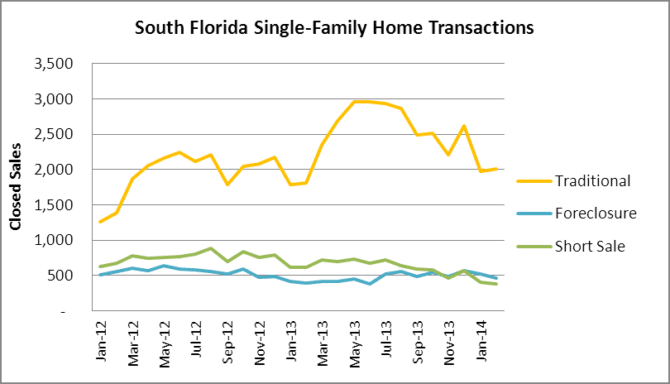
And here is a quick snapshot of the amount of closings in each of the three categories and you will notice that traditional sales have been slumping:
Moving on to the condo/townhouse market, here is a look at the median price.

The median sale prices in February were as follows:
- The median sale price of traditional condo/townhouse transactions was $160,000 in February
- The median sale price of a foreclosure transaction was $95,000 in February
- The median sale price of a short sale transaction was $105,000 in February
As for the breakdown of what types of deals have been closing, here is a quick look. You will notice that the short sales have continued to drop, especially since the mortgage debt relief act expired at the end of 2013.

This next chart illustrates how the pace of new foreclosure filings continues to outpace the distressed sales through February. If we are ever going to reduce the massive shadow inventory of foreclosures in South Florida, there will need to be a reduction of properties entering the foreclosure process. Basically, the green line in the chart below needs to be above the purple line for an extended period, then maybe we will start to see a true housing recovery.

Finally, here is a look at interest rates. The recent economic data has hammered the 10-year bond that drives mortgage rates. The good news is that rates should remain low for an extended period, but that just means that the economic data hasn’t provided the Fed with any reasons to raise rates. Just for kicks, look at the rate increases in the May-June 2013 period in the chart below, then scroll back up and look at how the traditional sales peaked in April 2013 for houses and condos, then fell off a cliff and never really recovered. Historically speaking, interest rates are still very low, but their impact on traditional sales clearly illustrates how sensitive the real estate market is to any increase in borrowing costs.
