Blog
South Florida’s faux housing recovery in two simple charts
Yes, things are improving so much in the South Florida residential real estate market that the new foreclosure filings are trending higher once again. We are roughly six years after the housing bust and still wrestling with the same problems. We will breakdown the data for each county over the next few days, but here is a snapshot:
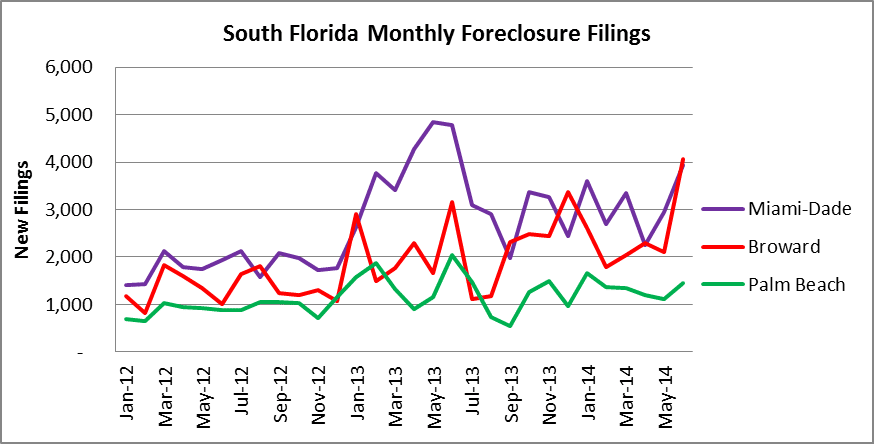
In the month of June, there were 9,439 new foreclosure filings in the tri-county area of Miami-Dade, Broward and Palm Beach County. In May, there were 6,136, so the June number represents a whopping 54% month over month increase. The monthly averages over the past few years are as follows:
- In 2012, the monthly average of new foreclosure filings in South Florida was 4,053
- In 2013, the monthly average of new foreclosure filings in South Florida was 6,861
- So far in 2014, the monthly average of new foreclosure filings has surpassed 2013 and has reached 6,956
Just add all of the new foreclosure filings to the massive shadow inventory of foreclosures scattered throughout South Florida:
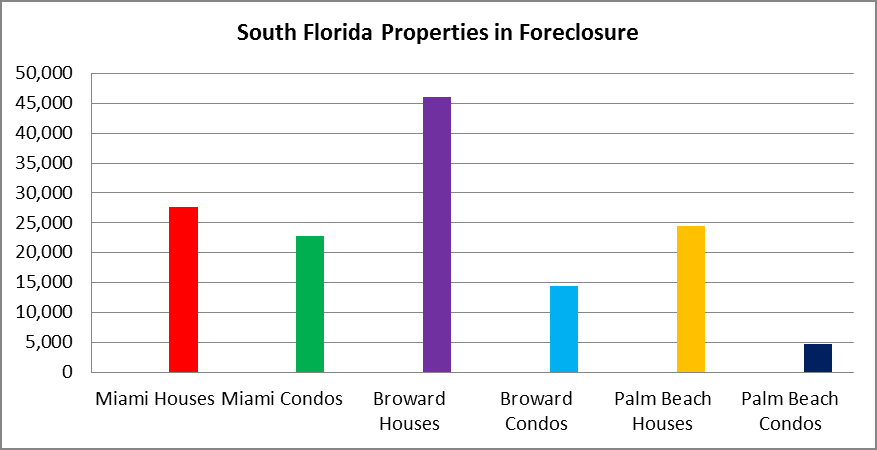
Keep in mind that this is a conservative chart. We search city-by-city throughout South Florida and the results are limited to 5,000 per city for each property type. With that being said, the Miami-Dade stats may be very conservative. This last tri-county tabulation was just over 140,000 residential properties in foreclosure. Will the real estate “experts” who give opinions in the local papers and national news channels ever mention the shadow inventory, or will they continue to ignore it as they have for the past six years? Maybe the news headline should be: “The South Florida market is awesome! People still aren’t paying their mortgages, but the market is awesome.”