Blog
Did South Florida’s "Housing Bubble 2.0" pop a few months ago when nobody was watching?
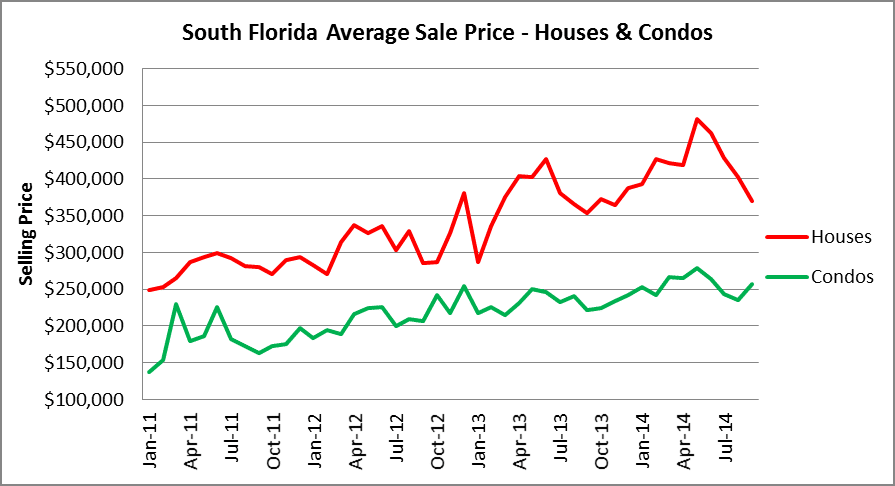
Today we are going to look at a few charts and you should be able to identify the noticeable drop in South Florida housing prices after they peaked in May. After reaching a peak of $481,218 in the month of may, the average sale price of single-family homes has dropped 23% to $369,817 in September. The average sale price of a condo/townhouse unit hasn’t been hit nearly as hard and is only down 8% from May. If you didn’t hear the bell go off when the market topped, maybe this chart will be of some assistance:
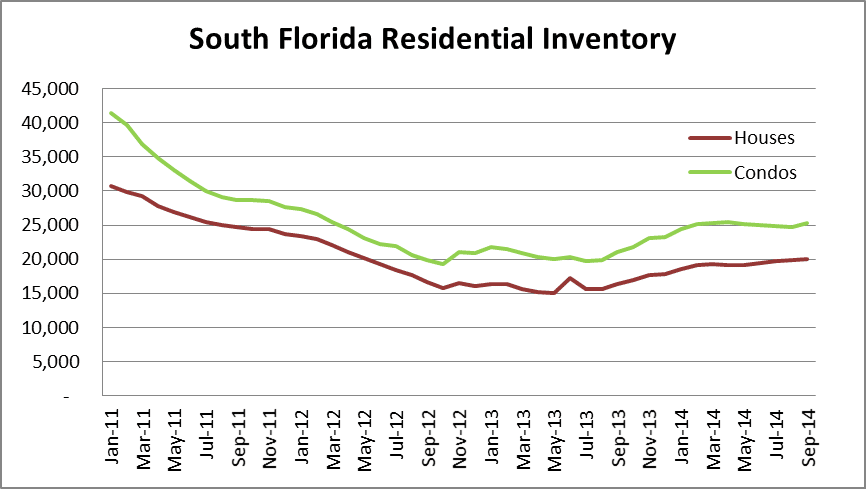
Now let’s take a quick look at residential inventory in South Florida, which has been on a slow climb higher over the past few years. The far left of our chart shows how there were over 70,000 properties on the market in early 2011, just as the banks abruptly pulled their inventory from the market due to the robo-signing litigation. Inventory is still down 37% from January 2011, but has been rising slowly and reached 45,302 houses and condos on the market in September.
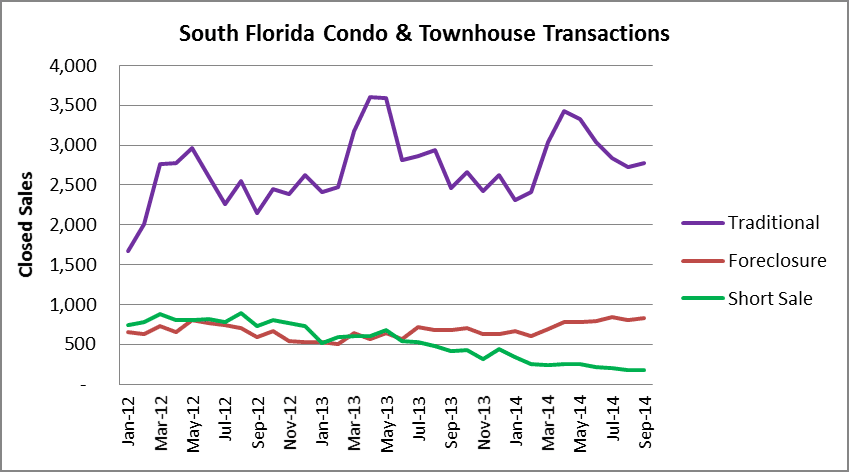
What types of deals are closing? The next few charts breakdown the house and condo sales by transaction type. First we look at the houses.
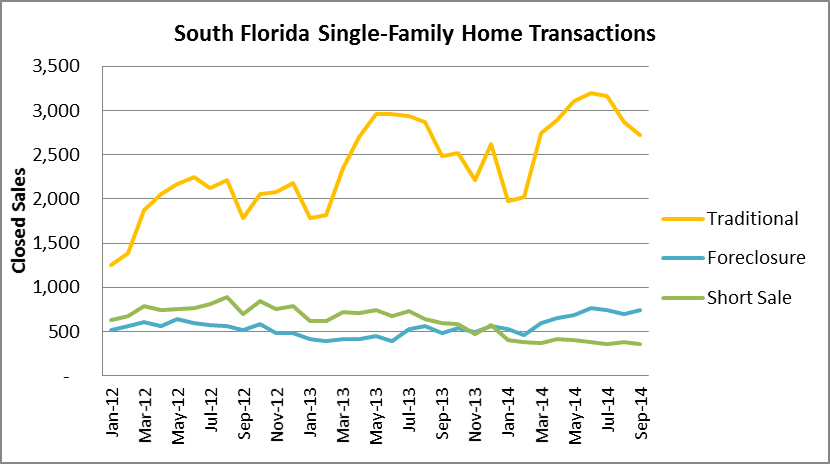
And a quick look at the condo/townhouse sales.
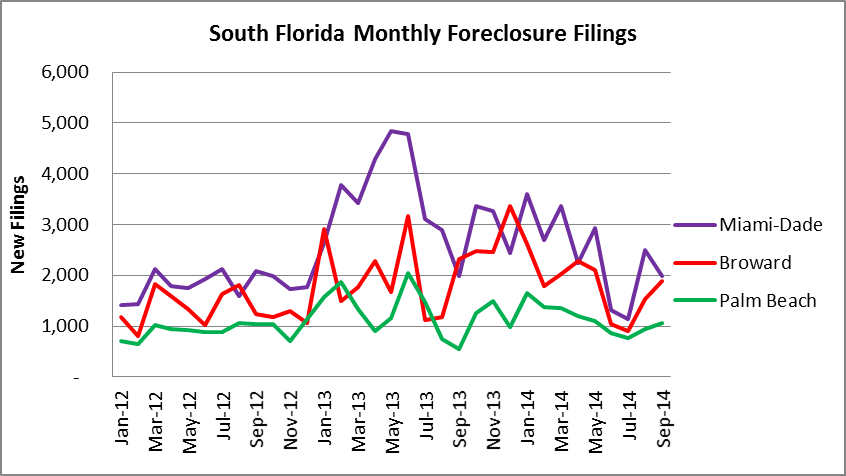
Finally, the foreclosure filings have been volatile lately, but certainly aren’t going away. There is still a massive inventory of properties in foreclosure and plenty of them have been lingering since the bubble burst.