Blog
Take a bite
At what point will higher mortgage rates take a bite out of residential real estate prices? By looking at a few charts, you will notice that it may already be happening. Here is a quick look at the trend in mortgage rates over the past five years. The 30-year conforming mortgage rate as per Freddie Mac climbed to 4.72% last week (not including fees and closing costs). This is a level that we haven’t seen since the financial crisis. Although these are still low rates, they will eventually start to impact real estate prices if they continue to climb. As housing affordability shrinks, don’t forget the risky mortgage loans that created the last crisis.

Take a look at sale prices of houses
The average sale price of single family homes have already started to take a hit. This next chart shows the prices of houses in Miami and Palm Beach have declines and Fort Lauderdale prices are holding-up (for now). There is a good chance that your local real estate agent is ignoring these numbers like Chief Wiggum. Here are the average sale prices for August:
- Miami – $538.263 down 10% from $598,494 in June
- Fort Lauderdale – $449,870 down 2% from $462,275 in June
- Palm Beach – $501,088 down 11% from $568,414 in June

Take a look at sale prices of condos
During the month of August we noticed a small bounce from July, but there is a good chance it will be short-lived. Here is a snapshot of the average sale prices of condo properties in South Florida:
- Miami – $397,106 down 10% from $439,546 in June
- Fort Lauderdale – $220,116 down 5% from $264,975 in June
- Palm Beach – $272,281 down 11% from $304,478 in June

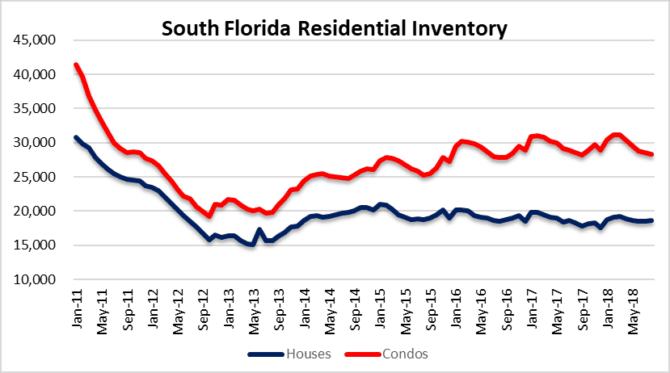
Take a look at residential inventory
Residential inventory is still in good shape as we move into the fourth quarter of 2018. As of August there were 18,662 houses and 28,267 condo properties listed for a total of 46,929 available properties in South Florida. If transaction volume declines due to higher rates, you will see inventory numbers start to climb higher. You may already be seeing listings sitting on the market for extended periods. The next phase will be a gradual build in residential inventory. This last chart goes back to 2011 when the South Florida market was flooded with foreclosures. Some of the REO inventory was sold, while a large share of bank properties were removed from the market due to the robo-signing litigation that started in late 2010. What’s crazy is that South Florida still has thousands of properties that have been in various stages of foreclosure since the crisis and will eventually reach the market after years of delay.