Blog
Today’s market focus: Single-family home sales, inventory & prices in the Greater Fort Lauderdale area
This morning we are going to zoom-in on the single-family homes sales in the Greater Fort Lauderdale area and look at current inventory levels, prices and transaction types. Our first chart today illustrates the median sale prices for each type of transaction through the month of June.
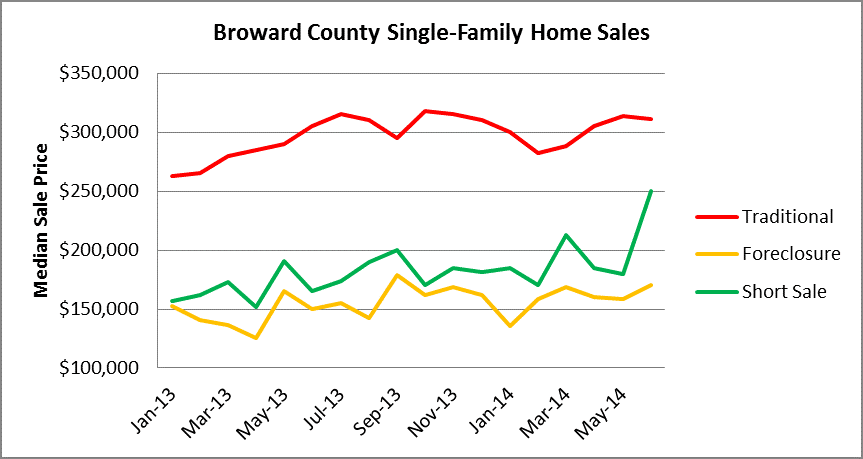
The median prices in June were as follows:
- The median sale price of a traditional sale in June was $311,500, down slightly from $313,500 in May
- The median sale price of a foreclosure sale in June was $170,000, up from $158,100 in May
- The median sale price of a short sale in June climbed to $250,000, up from $180,000 in May
The dramatic climb in the median short sale price (39% month over month), may have been the result of some short sales in the higher price ranges. This number is puzzling, especially since the mortgage debt forgiveness act expired at the end of 2013, so sellers really don’t have any incentive to short-sell their property.
Next, let’s see how many sales are closing for each transaction type.

Out of 1,425 closings in the single-family home segment for the month of June, here is how the numbers shaped-up:
- 1,078 sales were traditional sales
- 200 were foreclosure sales (up from 157 in May)
- 147 were short sales (down from 157 in May)
As for the available inventory for sale, it has been rising steadily after hitting a bottom in April 2013. In June there were 6,044 houses listed for sale in Broward County, which represents a 48% increase in available inventory since April 2013, when the number was 4,089 houses on the market. Obviously the recent firming of prices has brought more sellers out to test the market. As available inventory continues to grow, the rally in house prices will most-likely prove to be short-lived.

What’s next? Let’s take a look at the massive number of new foreclosure filings in June (3,208), compared to the amount of distressed sales (347). There were over 9x as many foreclosure filings as distressed sales during the month of June! This continues to be a troubling statistic, especially since there is still a very large shadow inventory of foreclosures scattered throughout Broward County.

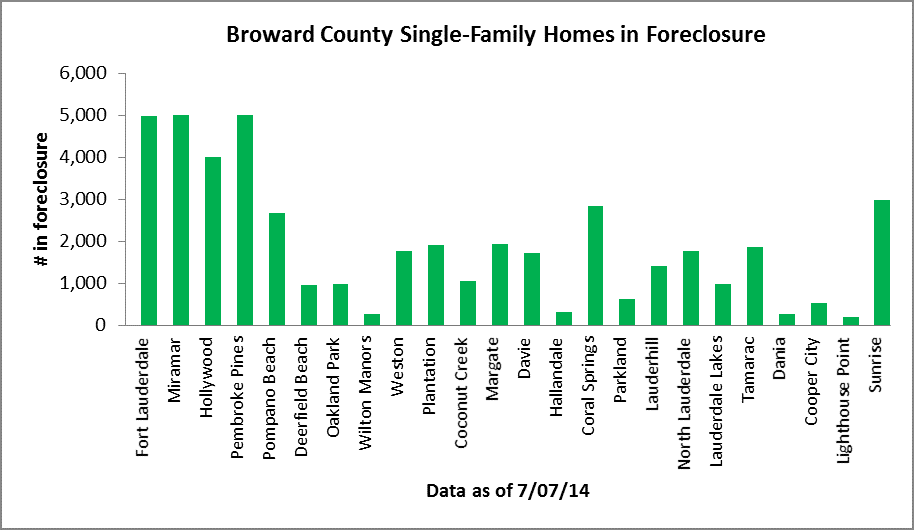
As for the shadow inventory of houses in foreclosure, here is a chart from July 7th that shows where the 46,000 houses in foreclosure are located throughout Broward County. Everyone has been ignoring this data for years, but from the looks of some of the latest data on a national level, this issue may be resurfacing very soon.
Finally, here is a snapshot of the monthly foreclosure filings in the single-family home market in Broward. This does not include the condo properties and we will add some research on that segment within a few days. Basically, if we were in a “housing recovery” as touted by the media pundits and trade groups, the trend line (in red), would not be sloped from the lower left to the upper-right.
