Blog
Year in review – 2018 foreclosures
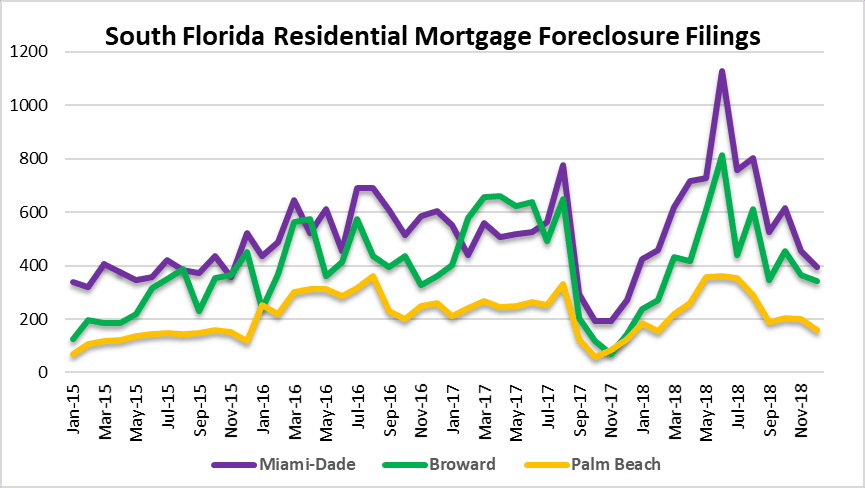
Today we will do a year in review with a look at foreclosure filing activity throughout South Florida. It’s crazy to think that ten years after the last housing bust, the delinquent mortgages still remain. There have been a variety of foreclosure halts in South Florida over the last decade. As a result, we continue to wrestle with this problem. Also, the fact thatFlorida is one of the 22 judicial states in the U.S. that doesn’t help matters. delinquent borrowers and their attorneys have gained years of experience on gaming the system. Our charts today illustrate the monthly foreclosure filings in Miami, Fort Lauderdale and Palm Beach houses and condo properties.
2018 foreclosures in Broward County, Florida
The months of may and June had a large number of new foreclosure filings in Broward County. There was a foreclosure halt in the 4th quarter of 2107 due to Hurricane Irma. As a result, there was a sharp decline in 4th quarter filings. Maybe it took awhile to get some of those filings cued-up again. It’s anyone’s guess at this point!

Here is a look at the Greater Fort Lauderdale / Broward County filings by the numbers:
| Annual | Monthly | Change | |
| 2015 | 3,356 | 280 | |
| 2016 | 5,044 | 420 | 50% |
| 2017 | 5,228 | 436 | 4% |
| 2018 | 5,341 | 445 | 2% |
2018 foreclosures in Miami-Dade County, Florida
The new filings in Miami remained strong through the summer months: May, June, July and August all had above normal filing counts. After that, the filings tapered off, but the averages in 2018 increased over 2107. Look at the September-December 2017 portion of these charts to see the last halt due to Hurricane Irma.
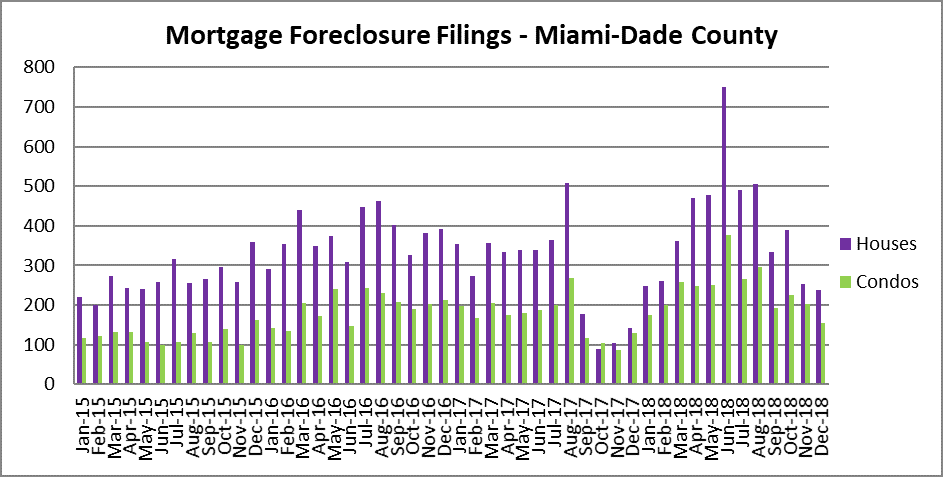
Here are the numbers and average monthly filings for Miami and the monthly averages:
| Annual | Monthly | Change | |
| 2015 | 4,638 | 387 | |
| 2016 | 6,855 | 571 | 48% |
| 2017 | 5,393 | 449 | -21% |
| 2018 | 7,622 | 635 | 41% |
2018 foreclosures in Palm Beach County
Palm beach seems to have fared better than Miami-Dade and Broward over the past few years, but still has it’s share of mortgage loan defaults.

| Annual | Monthly | Change | |
| 2015 | 1,706 | 142 | |
| 2016 | 3,295 | 275 | 93% |
| 2017 | 2,450 | 204 | -26% |
| 2018 | 2,935 | 245 | 20% |
Snapshot of the Tri-County area