Blog
A quick look at trends in South Florida housing inventory, prices and transaction types
Through the first quarter of 2013, it appears that we are still seeing the available supply of single family homes and condo/townhouse properties continue to slide.

The available supply of residential property has basically been cut in half since January 2011. In looking and Miami-Dade, Broward and Palm Beach County Florida, there are only 15,684 single family homes available for sale in March 2013, down from 30,768 in January of 2011. In the condo/townhouse market, available inventory has dropped to 20,926 units available for sale in the tri-county area, down from 41,473 in January of 2011.

The average selling price of a single family home in South Florida climbed back to $375,115 and the average selling price of a condo/townhouse property dipped slightly to$214,530 in March 2013.
Now for a glance at what types of transactions are closing in the single family residential real estate market in South Florida.

It appears that since prices have seen a temporary period of strength, more traditional sales are getting to the closing table. This is simply a matter of people feeling less “trapped” in their homes. Out of 3,487 residential transactions closed last month, here is the breakdown:
- Traditional sales – 2,352 transactions or 67% of all single family sales
- Foreclosure / REO sales – 415 transactions or roughly 12% of all single family sales
- Short sales – 720 transactions or roughly 21% of all single family sales
Next, we look at the condo / townhouse transactions in South Florida:

Wow, another big jump in traditional sales for this segment as well. Out of 4,431 closed transactions in the condo/townhouse segment of the market in March, here is what the numbers look like.
- Traditional sales – 3,181 transactions or 72% of all condo/townhouse sales
- Foreclosure / REO – 642 transactions or 14% of all condo/townhouse sales
- Short sale – 608 transactions or 14% of all condo/townhouse sales
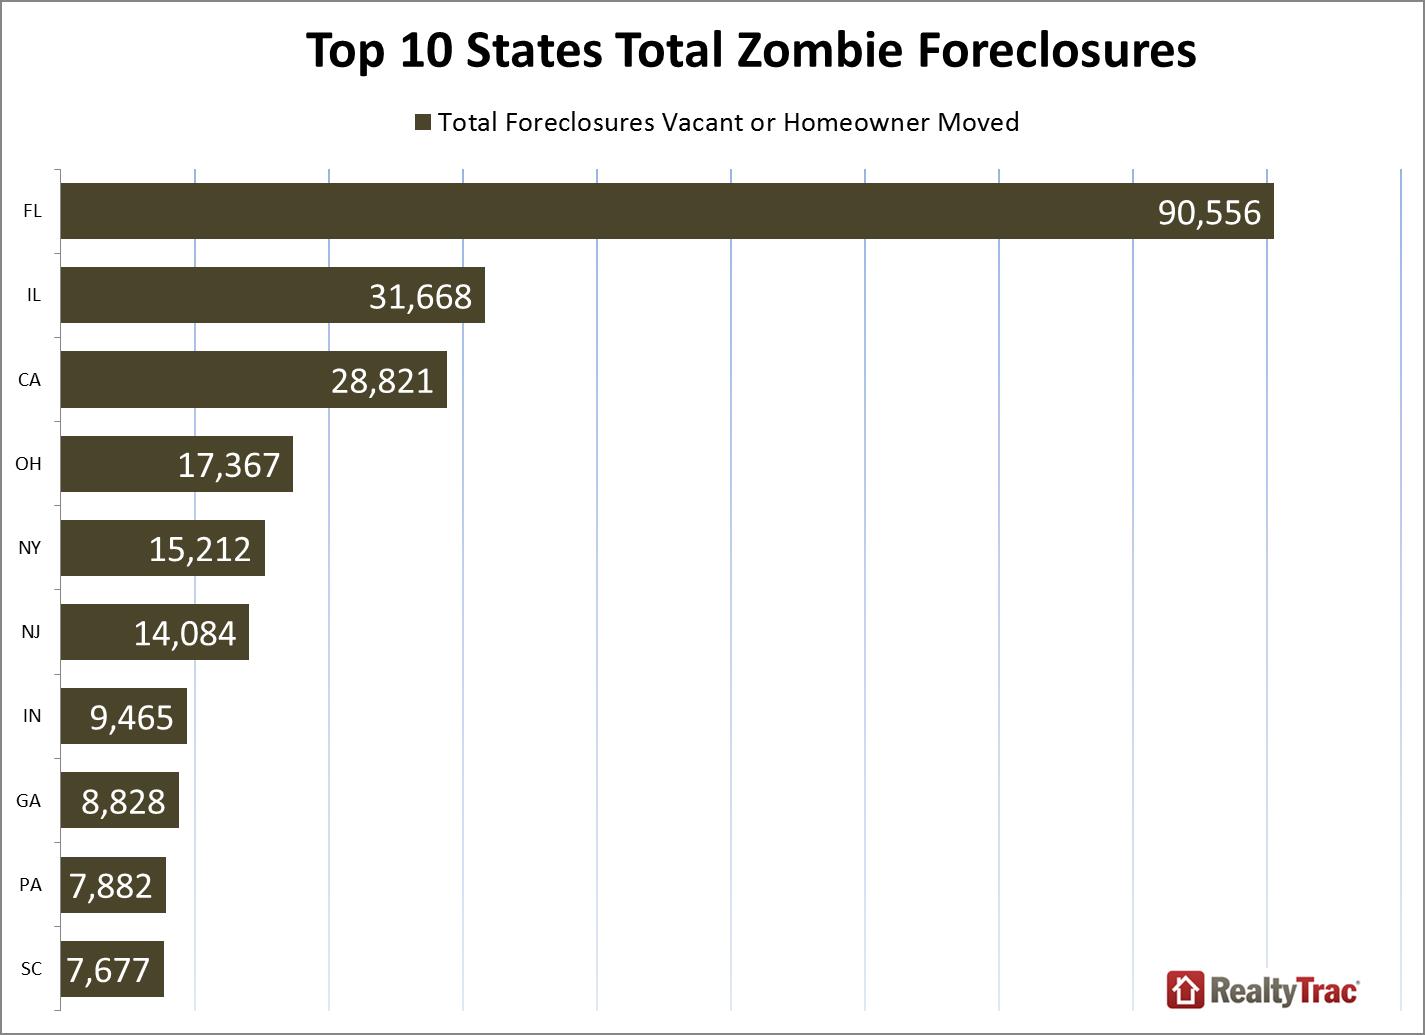
What needs to happen now is for all of the banks that halted their foreclosures back in late 2010 for the robo-signing litigation to now get these properties on the market and in the hands of people that will take care of them and actually make the payments. If you haven’t seen this next chart from Realtytrac yet, you will see that Florida ranks #1 in the country (by a sizeable margin) in zombie foreclosures. Take a look at this:
Keep in mind that these are just the abandoned bank-owned properties. This does not include the hundreds of thousands of properties currently in foreclosure and occupied by people who haven’t made a mortgage payment in several years. Over the past few months (january 2012-February 2013, here are the new foreclosure filing averages for the tri-county area:
- Miam-Dade County averaged 1,746 filings per month over the 14-month period
- Broward County averaged 1,333 filings per month over the 14-month period
- Palm Beach County averaged 890 filings per month over the 14-month period
Here is what the graph looks like and we will update it once we have the March 2013 figures:
