Blog
Good Times Bad Times
The real estate market has Good Times and Bad Times, just like the classic tune from Led Zeppelin. It seems like South Florida is ground zero for the boom and bust cycles and we could be at yet another turning point. Unless you have been hiding under a rock, you have probably noticed that housing affordability has been crushed in this latest boom. Well, it’s only a matter of time before the cycle turns again. How about looking at some charts?
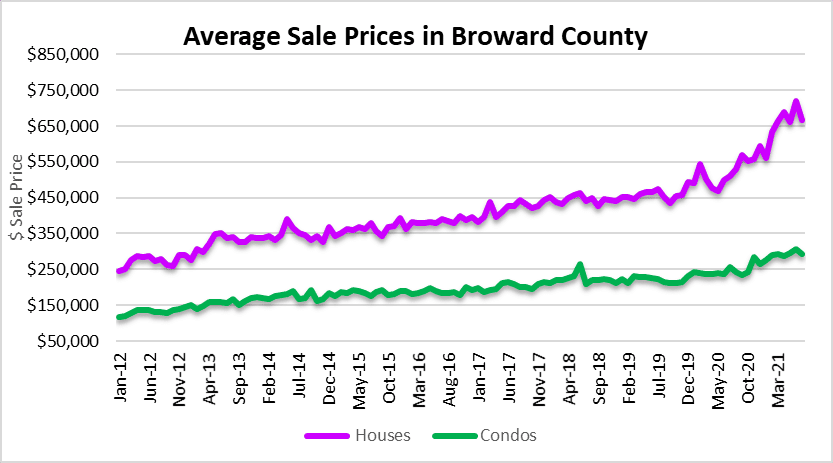
Well, it sure looks like sale prices finally peaked in the Greater Fort Lauderdale area. The average sale price of a single-family home declined 7% from a high of $719,293 in June to $667,853 in July. One month does not make a trend, but it sure appears to be moving lower from here after the COVID home buying mania rolls over. Condo prices declined 5% from $307,951 in June, to $292,311 in July.
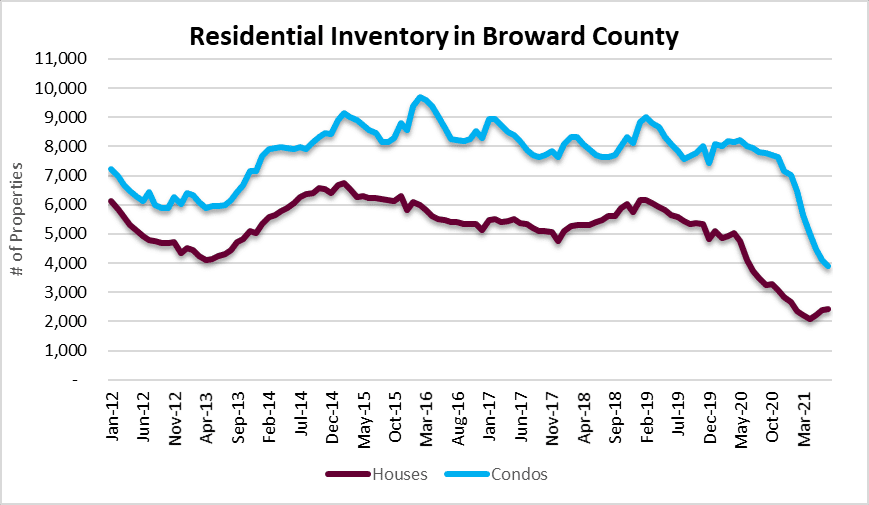
The existing inventory of houses is finally stabilizing after over a year of steady declines. There were 2,414 houses for sale in July, up from 2,405 in June. It’s not much, but at least it’s a start. Condo inventory was at 3,898 units for sale, down slightly from 4,097 in June.
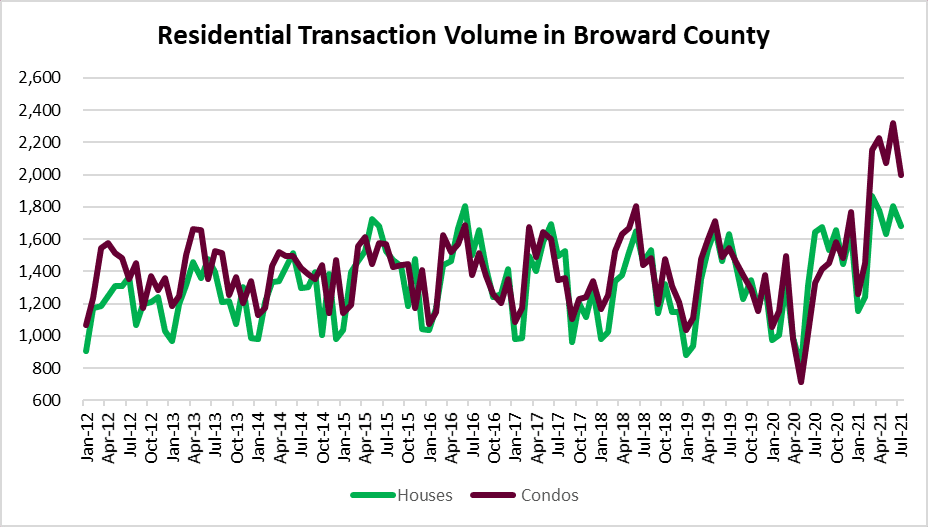
We saw the good times in transaction volume, are the bad times next? By looking at the above chart, it looks like deal volume fell off a cliff last month. There were 1,680 houses sold in July, down 7% from 1,803 in June. There were 1,999 condos sold, down 14% from 2,318 in June. Here is a glance at transaction volume in the Greater Fort Lauderdale area for the last decade:
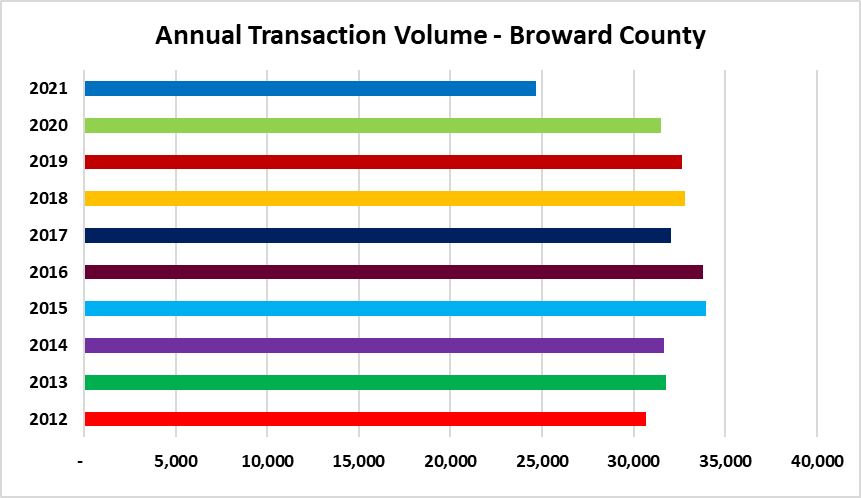
When we show how the average number of real estate transactions per month, 2021 is looking strong.
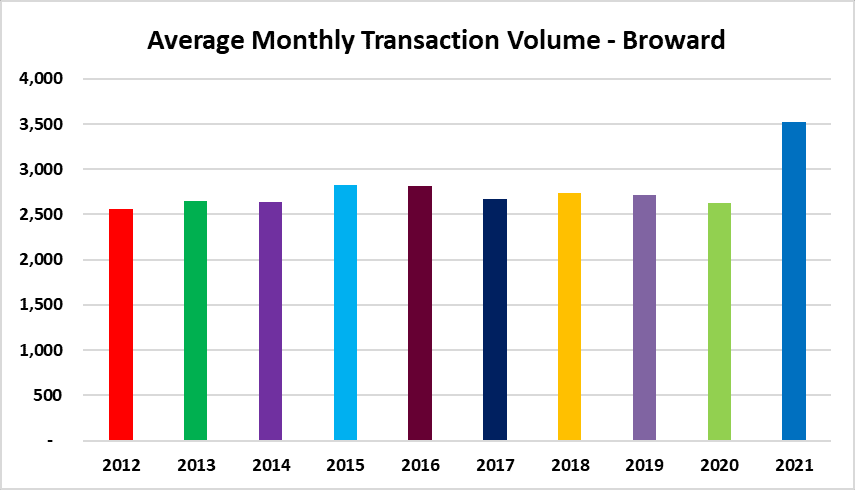
Here is the breakdown of the average transaction volume by year:
| Average Monthly Transaction Volume | |
| 2012 | 2,555 |
| 2013 | 2,647 |
| 2014 | 2,636 |
| 2015 | 2,829 |
| 2016 | 2,815 |
| 2017 | 2,668 |
| 2018 | 2,733 |
| 2019 | 2,717 |
| 2020 | 2,623 |
| 2021 | 3,520 |