Blog
Housing Bubble Update
The latest housing bubble in South Florida real estate looks like it has been leaking air. Nearly a decade of easy money in the form of record low mortgage rates helped create this monster and we aren’t sure how it will end. What we do know is that these distortions cannot last forever and there is always reversion to the mean. Today we will look at a few charts showing residential prices, transaction volume and foreclosure activity throughout South Florida.
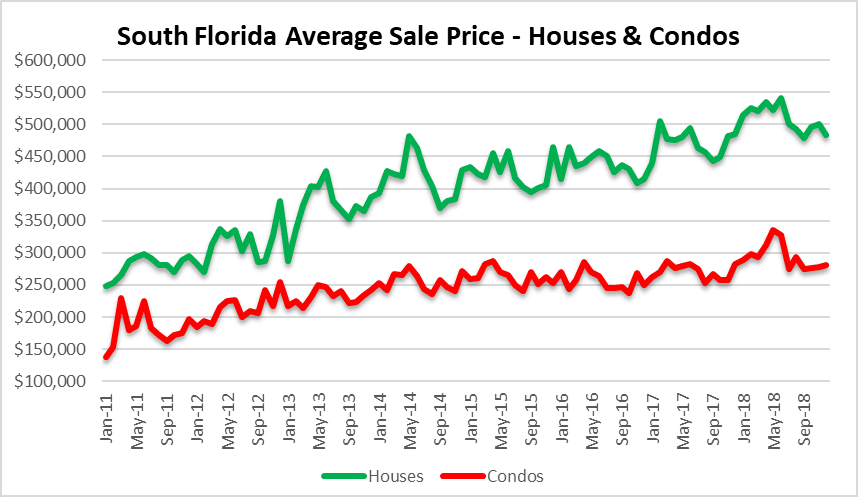
Housing Bubble – South Florida Real Estate Prices
The average sale price of a single family home in South Florida has declined 10% since June 2018. Condo prices have dropped 14% for the same period. You will notice from the chart below that June appears to be the peak in this latest cycle.
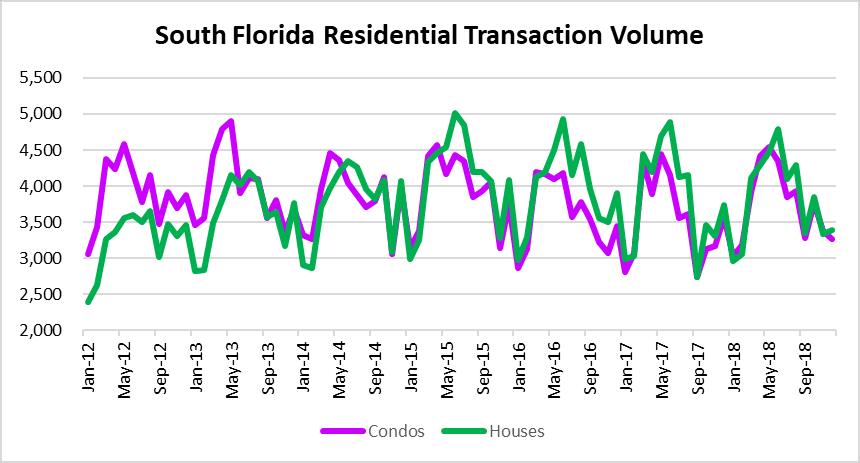
Housing Bubble – Transaction Volume
Some of the slowdown in transaction volume may be seasonal in nature. It may also be exhaustion of the last cycle. In December 2018 there were 6,647 closed sales, which represents a 9% decline from December 2017. The key to this next chart is if there is a strong rebound this spring. If not, that will prove an end to the cycle. Price declines typically follow a slowdown in sales activity as listings go stale and sellers begrudgingly lower their prices. Once sentiment changes, popping the latest housing bubble begins.
Here is a look at the annual numbers for residential real estate transaction volume:
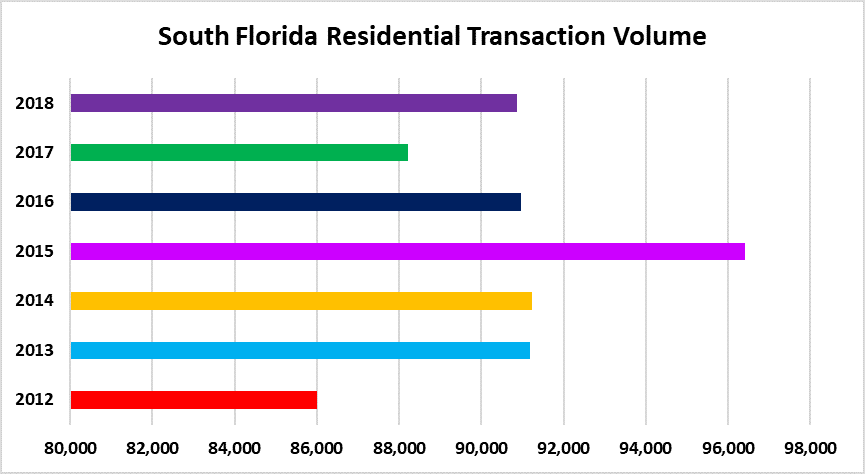
By the numbers……
| Annual | Monthly Avg | |
| 2012 | 86,001 | 7,167 |
| 2013 | 91,180 | 7,598 |
| 2014 | 91,239 | 7,603 |
| 2015 | 96,411 | 8,034 |
| 2016 | 90,974 | 7,581 |
| 2017 | 88,227 | 7,352 |
| 2018 | 90,870 | 7,573 |
Housing Bubble – Foreclosure Activity
After a large spike in new foreclosure filings last spring, it looks like the pace has settled down a bit. Here is a chart showing the tri-county area with some data for the last few years.
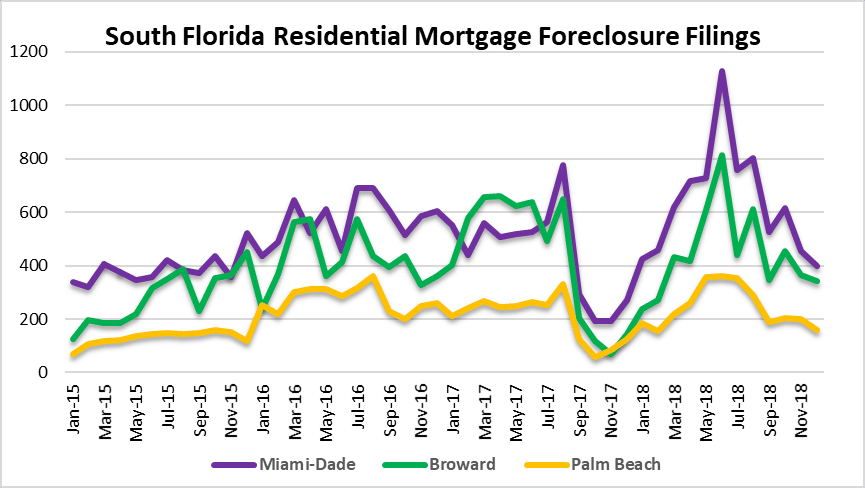
| Annual | Monthly | Change | |
| 2015 | 9 ,557 | 796 | |
| 2016 | 15,194 | 1,266 | 59% |
| 2017 | 13,071 | 1,089 | -14% |
| 2018 | 15,905 | 1,325 | 22% |