Blog
Housing prices in South Florida

Who is up and who is down in the South Florida residential real estate market? Housing prices in the tri-county are sometimes operate in sync, other times not so much. Today we will look at the average sale prices, existing inventory and transaction volume for each market. Our first chart shows the average selling price of houses in the tri-county area. We have talked at length about the impact of low interest rates lifting housing prices and crushing affordability. This first chart of rising housing prices in South Florida is a further evidence of the problem.
Housing prices in South Florida
- Miami-Dade – $599,468 was the average sale price of a house in that market in December. That is an increase of 12% from December 2018.
- Broward – $494,371 was the average sale price of a house in December, up 12% from $441,043 in December 2018.
- Palm Beach – $494,689 was the average selling price in December, up only 2% from December 2018.

Housing Inventory in South Florida
The number of available houses on the market declined across all three markets in December. Some of this decline is seasonal as many property owners remove their houses from the market during the holidays, only to relist in January. We will see if that happens again this year. These are the numbers for December:
- Miami-Dade – 6,190 houses on the market, down 10% from 6,872 last December.
- Broward – 4,824 houses on the market, down 16% from 5,757 last December.
- Palm Beach – 6,163 houses on the market, down 16% from 7,344 last December.

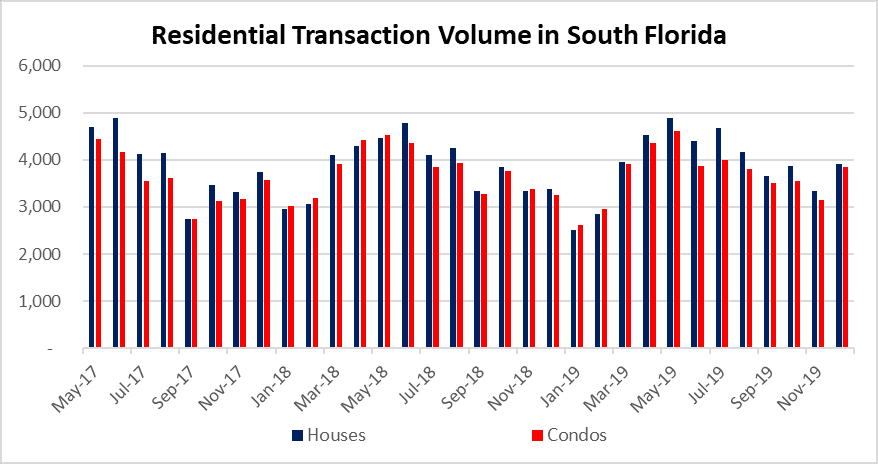
Transaction volume in South Florida
There was a slight uptick in the number of closed sales across the area in December. We will just compare the figures to last year, but you will also notice from the chart that January is typically a slower month.
- Miami-Dade – There were 1,174 closed sales, up 16% from 1,011 last December.
- Broward – There were 1,321 closed sales, up 15% from 1,147 last December.
- Palm Beach – There were 1,420 closed sales, up 16% from 1,229 last December.
Today we just looked at the single-family housing market, but this last chart shows the transaction volume for the area, including condo sales.
This real estate market outlook covers real estate activity in Miami-Dade, Broward and Palm Beach County, Florida. Here are just a few of the cities in each of these three markets:
- Miami-Dade – Aventura, Coral Gables, Miami Beach, Hialeah, Sunny Isles Beach, North Miami, Homestead, Doral, Miami Lakes, Downtown Miami, Brickell and Key Biscayne.
- Broward – Fort Lauderdale, Pompano Beach, Deerfield Beach, Hollywood, Hallandale, Weston, Parkland, Wilton Manors, Oakland Park, Plantation, Cooper City, Davie, Coral Springs, Sea Ranch Lakes, Lauderdale by the Sea and Lighthouse Point.
- Palm Beach – Delray Beach, Highland Beach, Jupiter, Palm Beach Island, Boynton Beach, Boca Raton, Highland Beach, Palm Beach Gardens, West Palm Beach, Wellington and Lake Worth.