Blog
Leading indicators
Leading indicators show that the housing market may finally be slowing. It started in California, which usually leads the remainder of the country when it comes to real estate. As for the latest South Florida numbers, there were some noticeable gains in single-family home prices, and a slight decline in condo prices. The average sale price of a house was $540,314 in June and the average price of a condo was $327,173.

Leading indicator – sales volume
Sales volume gained strength in the single-family home market with deal volume reaching 4,788 in June. As for the condo market, deal volume declined slightly to 4,353 transactions closed. We always say the price will follow sales volume, so any sustained decline in sales will lead to lower prices. This chart clearly shows that June is a strong month each year, so a drop in the next few months is expected.

Leading Indicator – Mortgage Foreclosures
Nobody wants to talk about the elephant in the room: South Florida Mortgage Foreclosure activity. This next chart shows that we have a dramatic increase in new foreclosure filings throughout South Florida. We haven’t seen this may filings since the financial crisis nearly a decade ago. This problem should not be ignored if you are buying / speculating in the South Florida residential real estate market. Your real estate agent should be able to show you if the market you are looking to purchase a property has an overhang of properties in default. It takes a very long time for foreclosures to make their way through the court system, but eventually these properties hit the market and drag prices down with them.
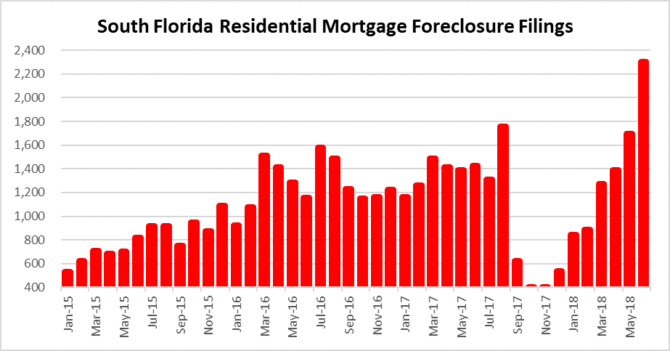
As for the monthly and annual foreclosure filing averages across South Florida, take a look at the numbers:
| Annual | Monthly | Change | |
| 2015 | 9,557 | 796 | |
| 2016 | 15,194 | 1,266 | 59% |
| 2017 | 13,071 | 1,089 | -14% |
| 2018 | 8,397 | 1,400 | 28% |