Blog
Limited supply
There’s a limited supply of houses available for sale across South Florida and it could get worse before it gets better. Since the pandemic there has been a rush to buy single-family homes at any cost. Depending on the amount of leverage people are using, this could create some issues if an when recent buyers paying peak prices try to sell their properties. Don’t forget that South Florida was ground zero when the housing market crashed last time and excessive debt during the prior boom was the catalyst. The current mortgage rates entice people to take larger risks and that can be dangerous this late in a housing cycle.
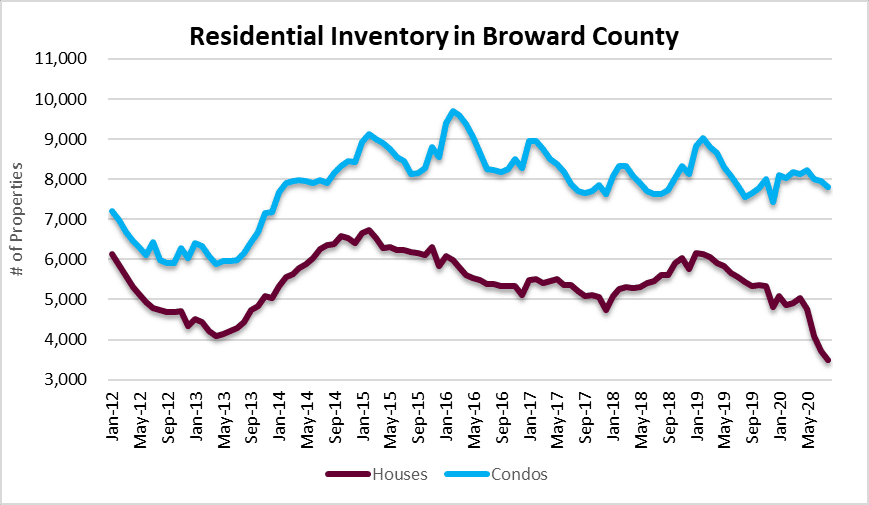
Today our charts look at the current market in Greater Fort Lauderdale / Broward County, Florida. The first chart shows the number of houses and condos listed for sale in the area, with 3,492 houses and 7,799 condos listed for sale during the month of August. This chart goes back to 2012 and we haven’t seen inventory levels this low in the single-family home segment during the past nine years.
Average sale prices
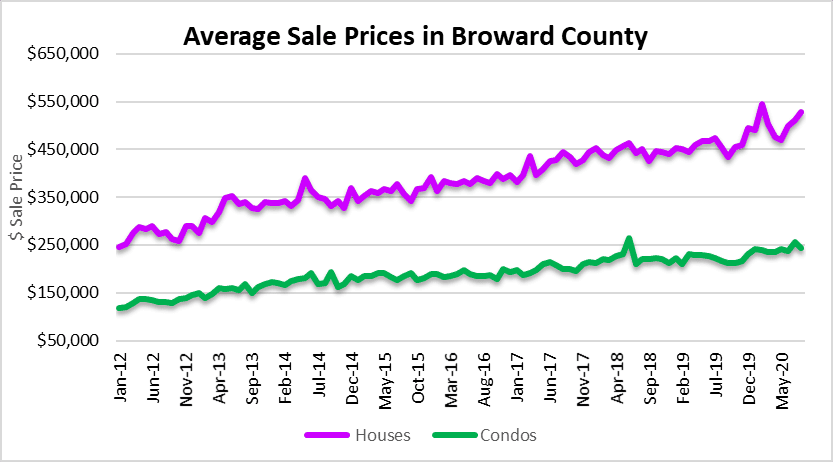
The increased demand for houses has driven prices higher. In August the average selling price of a single-family home was $528,622. The highest point during this cycle was $544,134 during the month of February, so it will be interesting to see if we surpass that number this year. Condo properties haven’t seen the same demand levels and the average sale price was $243,083 in August, down from $256,546 in July.
Will transaction volume slow?
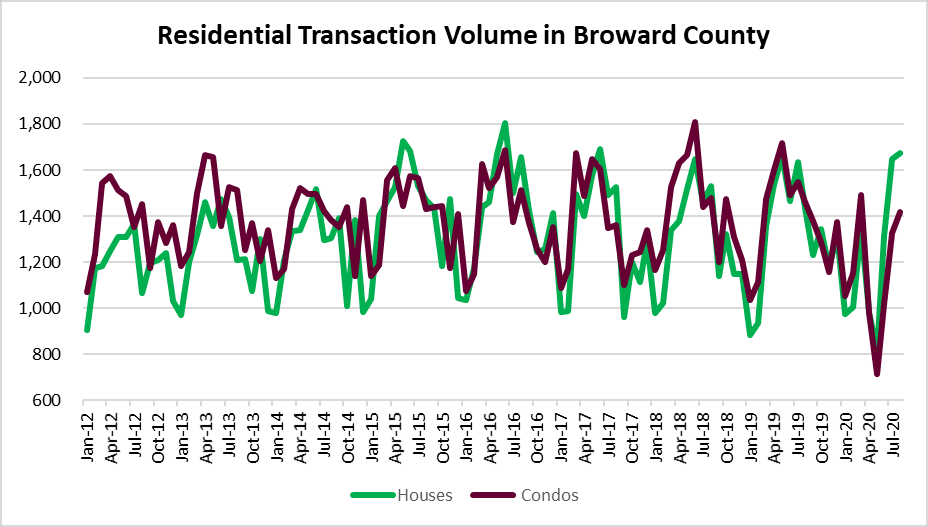
After a sharp slowdown during the spring lockdown months, the number of closed sales rebounded over the summer. There were only 1,529 closed sales during the month of May, but August doubled that figure with 3,089 closed sales in the house and condo segments combined. The question is whether buyers will keep bidding-up the current supply or decide to sit on the sidelines until the dust settles from this mania.
This next chart shows the average monthly transaction volume since 2012. What happens if there is such a limited supply of houses available for sale that deal volume craters?
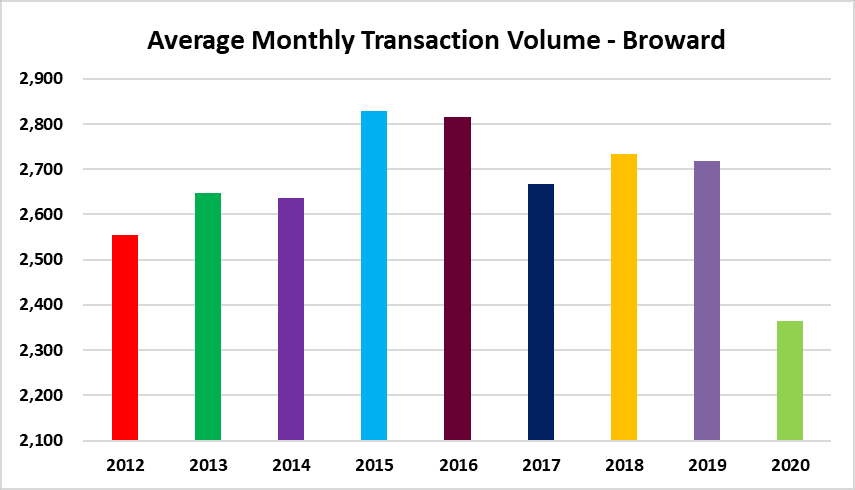
Here is a snapshot of the averages for each year included in the chart:
| Average Monthly Transaction Volume | ||
| 2012 | 2,555 | |
| 2013 | 2,647 | |
| 2014 | 2,636 | |
| 2015 | 2,829 | |
| 2016 | 2,815 | |
| 2017 | 2,668 | |
| 2018 | 2,733 | |
| 2019 | 2,717 | |
| 2020 | 2,364 | |
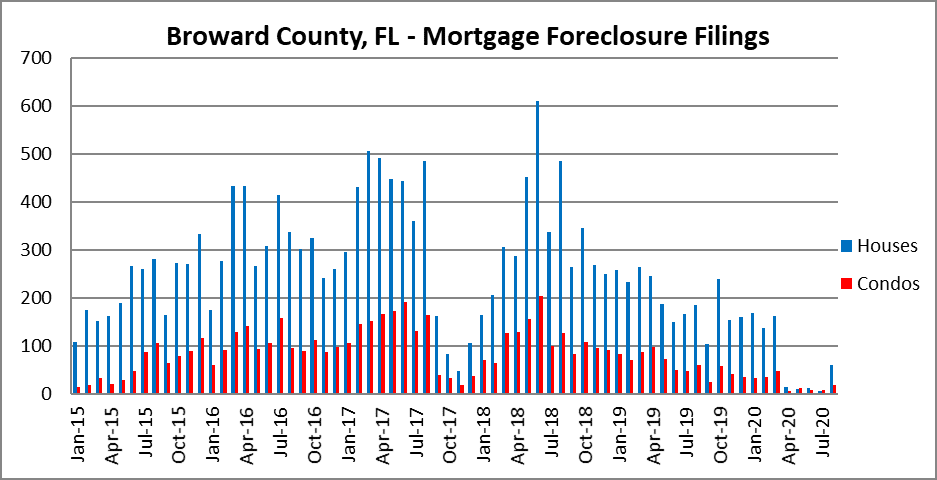
Limited foreclosure activity
Due to COVID-19 there have been restrictions placed on foreclosures and evictions. This chart shows how new foreclosure filings have been at a standstill since April.
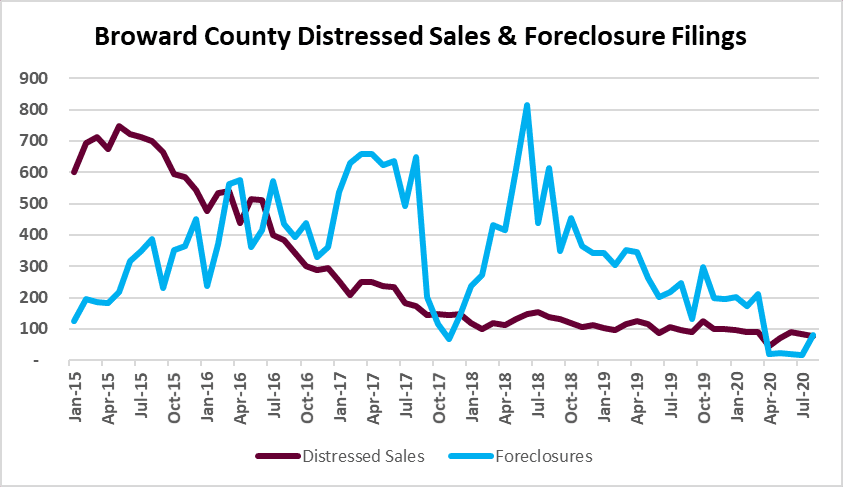
Limited supply of distressed property for sale
There haven’t been many short-sales or REO transactions lately either. Don’t expect these to pick-up anytime soon. This chart shows the correlation between distressed sales and new foreclosure filings.
When COVID-19 caught everyone off guard earlier this year, it was difficult to predict how it would impact South Florida real estate. In our last post, we shed some light on the massive amounts of assistance that was thrown at the crisis. All these programs, coupled with historically low mortgage rates have destroyed affordability and pushed the current housing bubble to extremes.