Blog
Monitoring the distressed property market in Miami-Dade County, Florida
We always tell our readers that one month does not make a trend, so to help everyone see patterns developing in the markets, we have added a trend line to our charts of new foreclosure filings. Let’s take a look at the total of new filings for Miami-Dade County.

In June there were 3,934 new residential foreclosure filings in Miami Dade, up from 2,936 in May. As for the annual averages, let’s see how 2014 compares to the past few years:
- In 2012, the monthly average of new foreclosure filings was 1,807
- In 2013, the monthly average of new foreclosure filings was 3,399
- So far in 2014, the monthly average of new foreclosure filings is 3,127
The chart above clearly shows that the trend line of new filings is moving from the lower-left to the upper-right of the chart. Yes, the trend continues to rise. Even as people are talking about the housing recovery in South Florida, we are seeing an increasing problem and a crack in the foundation of this recovery.
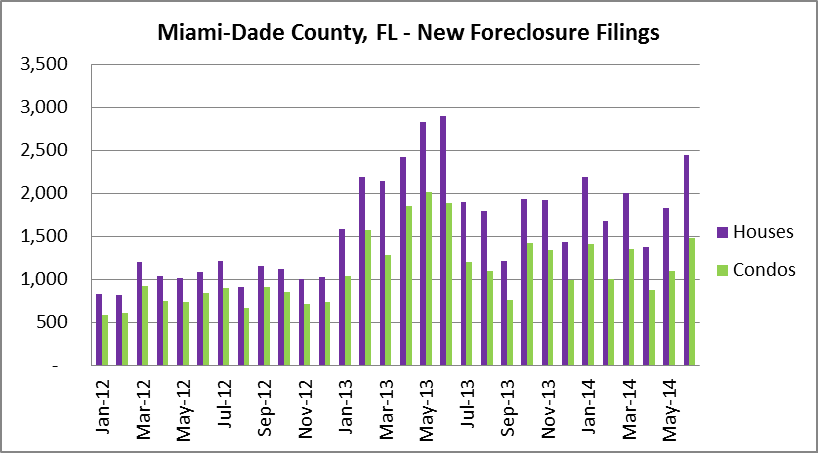
Next, we will take a look at the breakdown of house & condo foreclosures. In the month of June there were 2,448 single-family home foreclosure filings and 1,486 condo/townhouse filings.
As for all of the properties throughout Miami-Dade County that are in foreclosure, here is a chart which shows where they are located. You will notice that several cities have reached the 5,000 property limit in our search, which basically means that our total count of just over 50,000 foreclosures is a conservative one! Although certain areas of Miami have seen large price increases over the past few years, there are still some serious underlying problems in the Miami market. Feel free to click on the chart to enlarge.
