Blog
Is South Florida’s housing bubble 2.0 losing some air?
After several years of easy money from the Fed, it sure looks like the housing bubble 2.0 in South Florida may be starting to deflate. The Federal Reserve started it’s quantitative easing back in 2008 and the widespread asset price inflation was off to the races. The result has been about six years of inflating bubbles across all asset classes. It is just a matter of time before these bubbles either gradually deflate or “pop” in the form of price correction and normalization of prices. let’s see what has been happening in the South Florida residential real estate market.
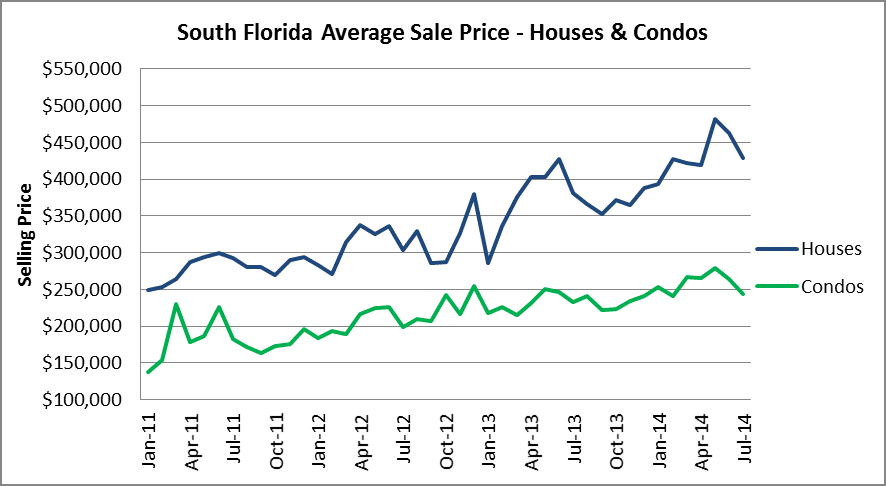
By looking at the chart above, you will see that May appears to have been the most recent top in house and condo prices in South Florida. In May, the average sale price of a house in South Florida was $481,218 and that figure has dropped 11% to $428.905 in the month of July. As for condos, the average sale price was $278,624 in May and has dropped 13% to $243,139 in July. We never just take one month of data to determine a trend, so when you see the chart of the last few months, it sure looks like there may be a new downward trend developing in prices. Most people read the headlines in the newspaper without looking at the numbers, so these charts are very helpful in sorting out the noise.
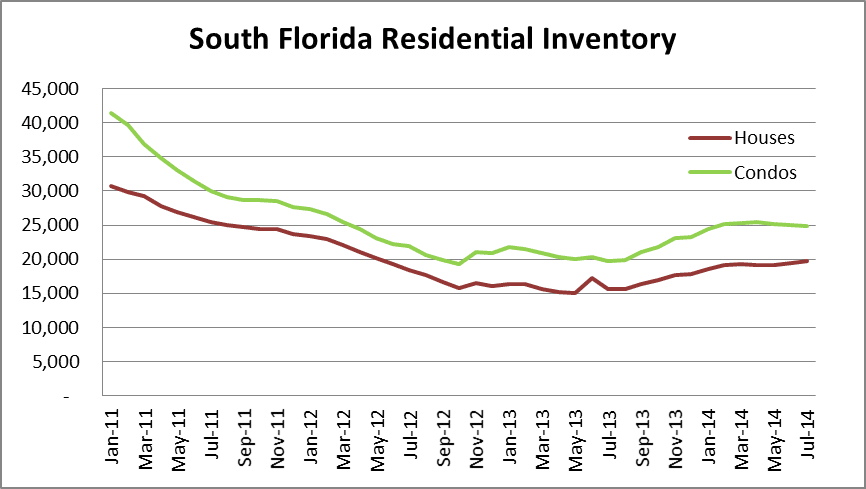
How about residential inventory? This next chart shows the available inventory in Miami-Dade, Broward and Palm Beach County all the way back to January 2011 just after foreclosures were halted in the robo-signing litigation. At that time, there were 72,241 houses and condos on the market and although inventory has started to grow again, it remains 38% lower at 44,570 in July. What’s interesting is that many of the foreclosures that were removed from the market back in late 2010 and early 2011 are still tied-up in the foreclosure process and will eventually reach the market again.
What types of deals are closing? here is a chart showing the single-family home transaction types in South Florida.
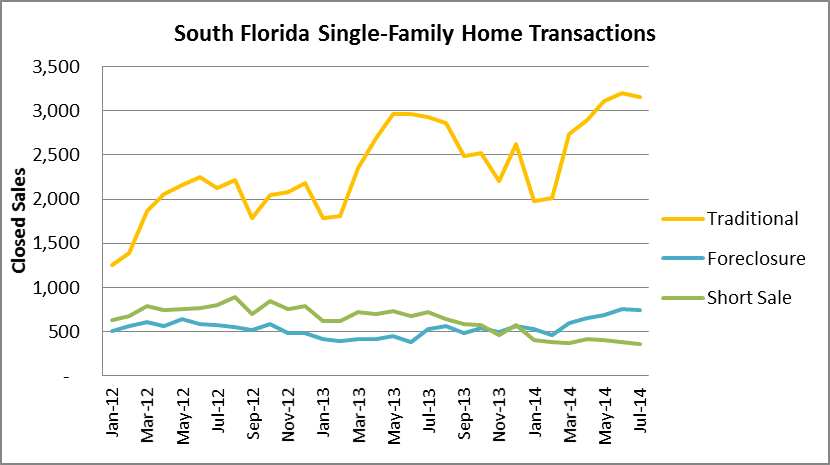
There were 4,260 single-family home sales in July in the tri-county area and the breakdown is as follows:
- 3,157 (74%) were traditional sales
- 742 (17%) were foreclosure sales
- 361 (9%) were short sales
As for the condo sales, here is a look at the breakdown by transaction type.
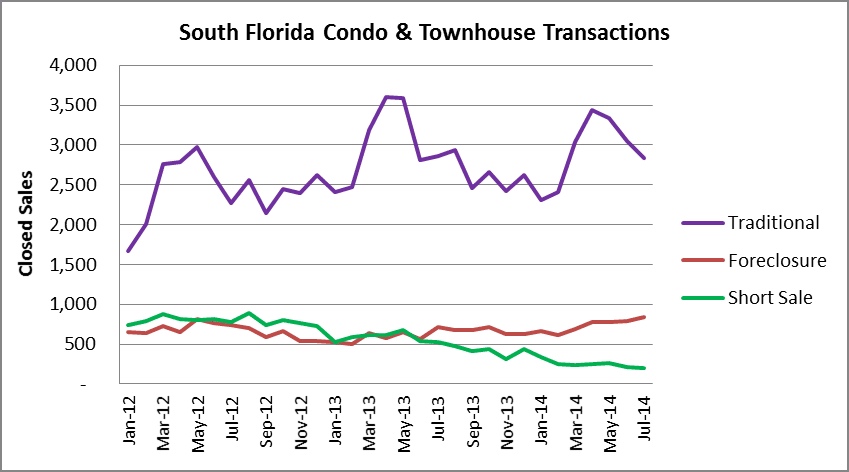
By looking at the chart above, it sure looks like traditional sales hare falling off a cliff. here is a chart summary of the 3,877 closings in July:
- 2,839 traditional sales were 73% of all closings. The number of traditional sales may have peaked in April at 3,432 and has dropped 17% since then
- 841 transactions were foreclosure sales (22% of closings)
- There were 197 short sales (5% of all closings)
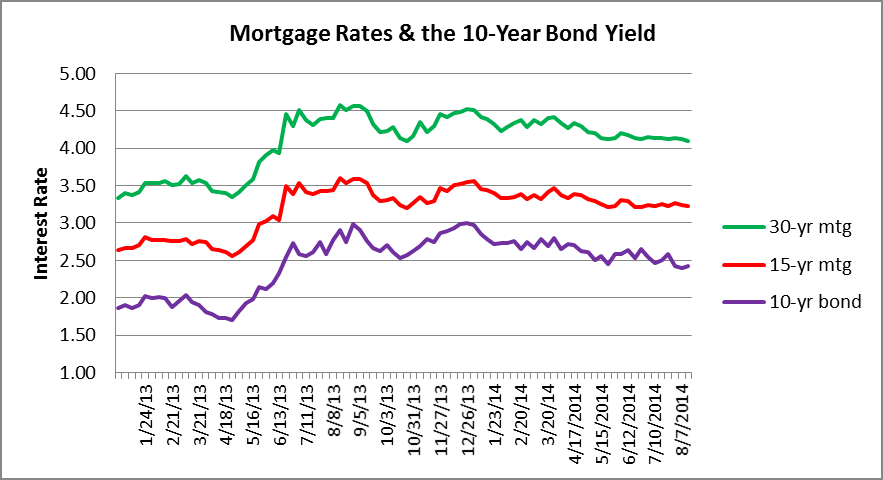
So why is the price deflation so surprising? Our final chart today shows how interest rates are still at ridiculously low levels. What we find troubling is that if the housing bubble 2.0 is starting to deflate in such a low-rate environment, what will happen when rates begin to climb? Look out below!