Blog
Spring is in the air
Spring has arrived in South Florida, which means it is slightly warmer than winter and not as hot as summer just yet. Our charts of the Miami-Dade, Broward and Palm Beach residential real estate market are shaping up nicely, so let’s get cracking on them.
A glance at prices as we move into spring
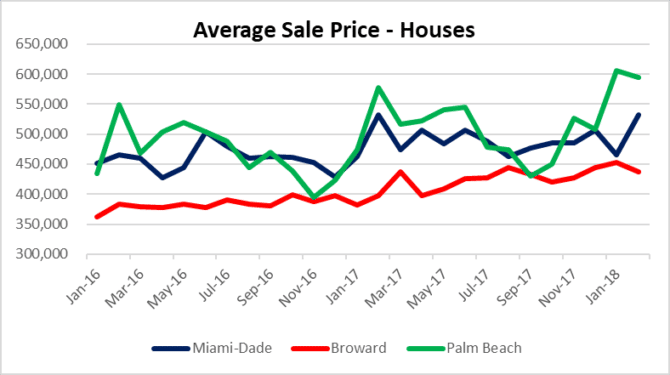
Here is a quick look at the average sale prices of single-family homes throughout South Florida. As of February, the average sale price for each county was as follows:
- Miami-Dade – $531,889, up from $465,672 in January
- Broward – $431,771, down from $453,087 in January
- Palm Beach – $594,330, down from $606,112 in January
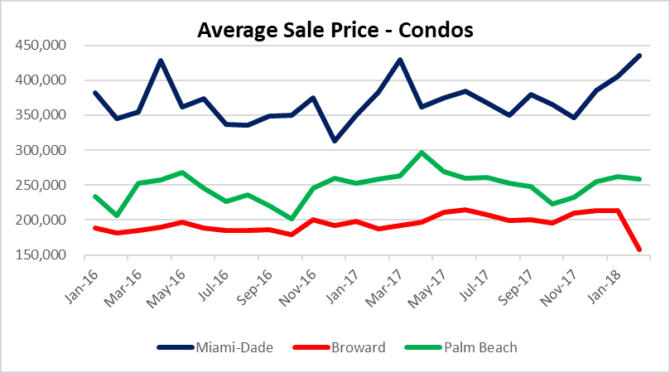
As for the condo market in South Florida, here is a summary of the average sale prices by county for February:
- Miami-Dade – $435,262, up from $406,131 in January
- Broward – $158,000, down from $213,193 in January
- Palm Beach – $258, 179 down from $261,987 in January
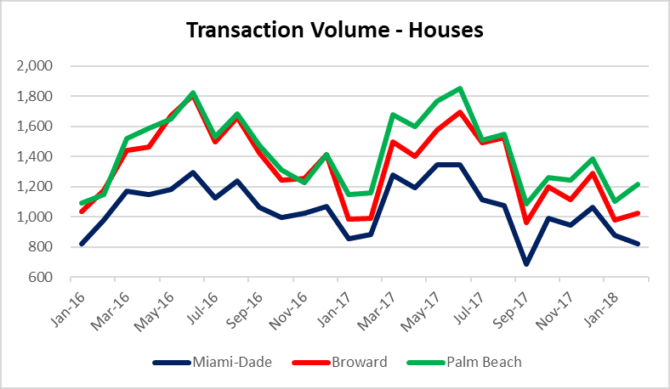
Spring is usually “buying season”
If you look back at 2017, there was a significant jump in transaction volume for houses in South Florida. We will see if the spring this year has similar strength.
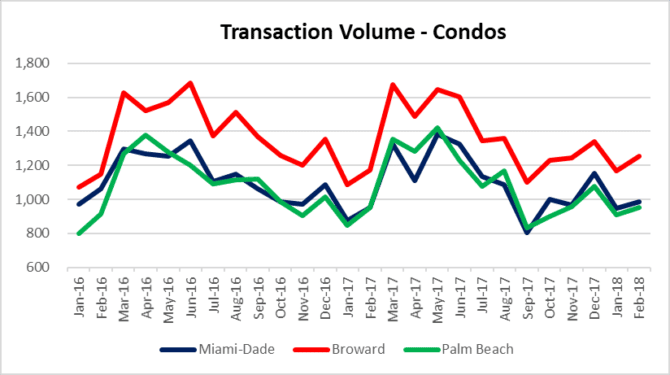
As for the condo market, we are waiting to see deal volume pick up.
Here is a quick snapshot of the transaction volume for houses and condo properties in Miami-Dade, Fort Lauderdale and Palm beach County Florida since last May:
| Transaction volume in South Florida | ||
| Houses | Condos | |
| May-17 | 4,691 | 4,450 |
| Jun-17 | 4,893 | 4,155 |
| Jul-17 | 4,119 | 3,553 |
| Aug-17 | 4,147 | 3,610 |
| Sep-17 | 2,735 | 2,738 |
| Oct-17 | 3,455 | 3,129 |
| Nov-17 | 3,305 | 3,167 |
| Dec-17 | 3,743 | 3,567 |
| Jan-18 | 2,957 | 3,023 |
| Feb-18 | 3,060 | 3,188 |
The next data point that we have been keeping an eye on is the pace of new residential foreclosure filings throughout South Florida. A few weeks ago, we provided a South Florida residential Foreclosure update
Here is the latest chart and data. It is clear that this market is still plagued by plenty of distressed properties.
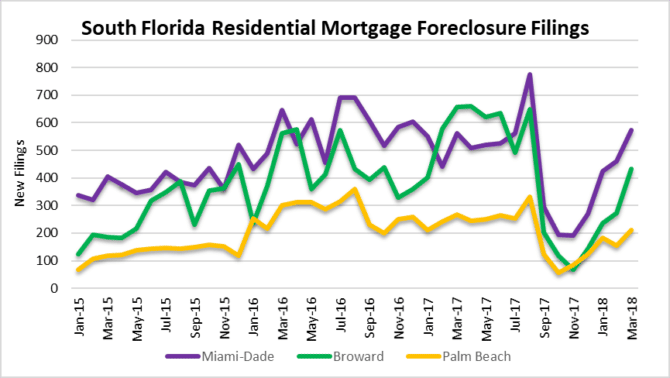
South Florida foreclosure filings by the annual and monthly numbers:
| Annual | Monthly | Change | |
| 2015 | 9,557 | 796 | |
| 2016 | 15,194 | 1,266 | 59% |
| 2017 | 13,071 | 1,089 | -14% |
| 2018 | 2,948 | 983 | -10% |
Last week we read an interesting article on CBS Marketwatch about people using their houses as ATM’s Housing ATM…again? We have discussed repeatedly how the low interest rates for nearly a decade have enticed borrowers to take on tremendous debt loads. Time will tell how this plays out!