Blog
What to watch in 2017
There are a few areas to watch as we begin 2017 and we will highlight them with new charts. After eight years of artificially suppressed interest rates, all asset classes could enter a new era of volatility. Here are a some data points worth keeping an eye on as we move through the year:
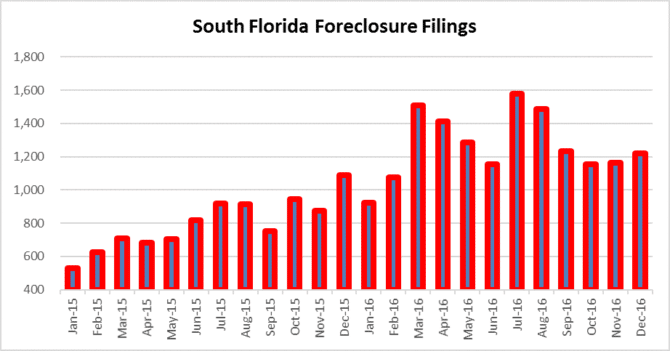
Watch new foreclosure filings
Major lenders took yet another break from filing foreclosures in the last few years until a recent decision in Florida Supreme Court. In a nutshell, they will now be able to refile cases outside the 5-year statute of limitations. There are still tens of thousands of cases and several hundred million dollars in assets held in limbo up to this point. People forget that many of the unresolved cases date back to 2008. Look for new filings to gain momentum as we move through 2017. As for the average number of residential filings in South Florida over the past few years:
- The 2015 monthly average was 796
- In 2016, the monthly average climbed 59% to 1,266
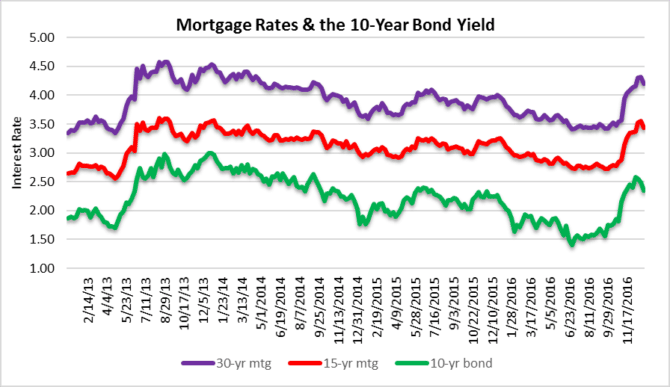
Watch bond yelds and mortgage rates
Bond yields rallied after the election, but tapered-off as 2016 came to and end as investment portfolios needed to be re-balanced. After reaching close to 2.60% in mid-December, this week the 10-year bond yield closed around 2.42%. It is likely that bond yields will slide in the near-term, but will resume their climb as we progress through the year. A few key levels to watch on the upside are as follows:
- A close over 2.62% should send the 10-year bond yield higher to the 3.00% level
- If the 10-year bond yield rallies and closes over 3.00% (3.03% to be specific), it is highly likely to rally much further, with mortgage rates climbing over 5.00%. These levels are still very low by historical standards, but could be problematic for real estate markets.
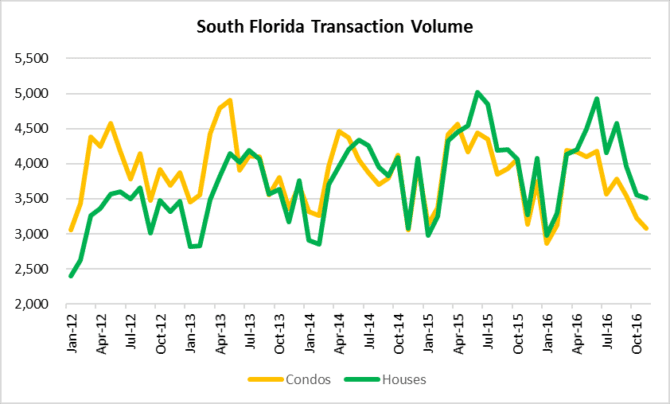
Transaction volume
Deal volume has dropped, but we will have to watch the first few months of 2017 to see if this translates to something more than a seasonal slowdown. You will notice from the chart below that transaction volume declined toward the end of the past few years, reaching lows in January. Typically extended periods of lower transaction volume are followed by price declines, so we will have to look toward the second quarter of 2017 to see if this continues into the spring.
- In 2015, the average monthly transaction volume was 8,034
- Through November of 2016, monthly deal volume has declined 5% to 7,602
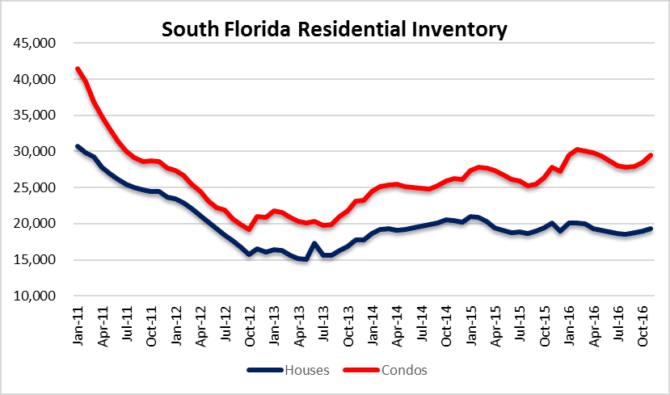
Inventory levels
The residential inventory reached a low point back in may of 2013 with 35,123 houses and condos listed for sale. Since that point, inventory has climbed 39% to 48,822 in November. As you will notice from the next chart, houses are at a reasonable level at 19,355. Keep an eye on condo inventory, as it reached 29,487 units without the shadow inventory of new construction projects.
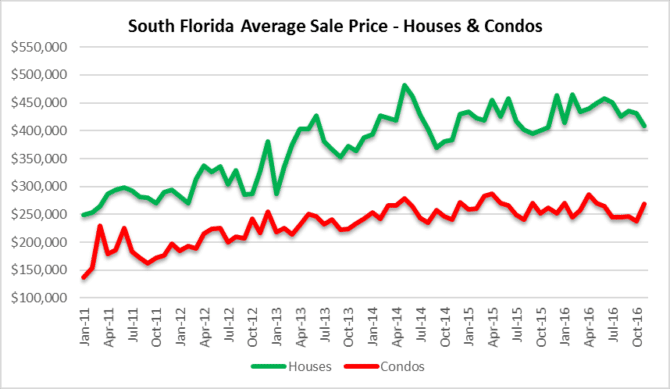
Sale prices
The average selling price of condos actually rose slightly to 268,753 in November, as house prices dropped $409,216. Obviously the above charts of inventory, transaction volume and mortgage rates will determine where prices go in 2017. The foreclosure filings will have a lesser impact, because the timeline of filings to sale date are still ridiculously long in judicial states like Florida.