Blog
What to watch in the condo market
What are a few things to watch in the South Florida condo market? Inventory, transaction volume and sale prices will tell you everything you need to know. Today we will take a look at the Broward County / Greater Fort Lauderdale market with some charts.
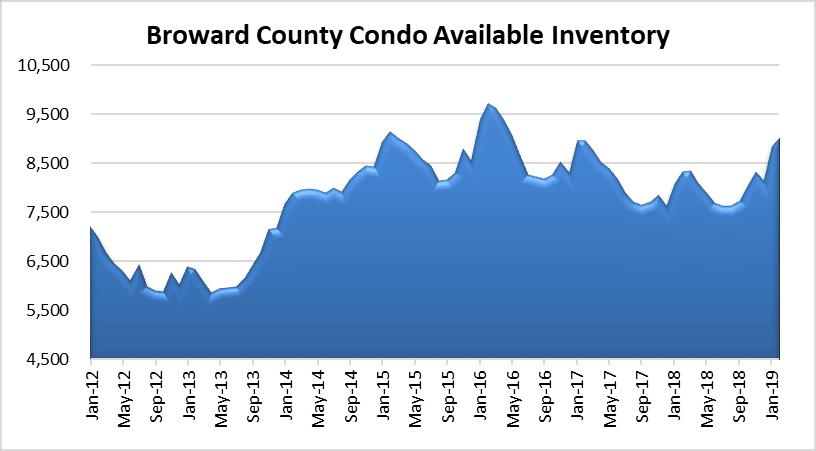
Available condo inventory
The number of condos on the market in the Greater Fort Lauderdale area climbed to 9,019 units last month. This represents a 17% increase in available inventory since the peak in June 2018. Keep in mind that this number doesn’t include all of the new construction condo projects. With developers only listing a small fraction of their project in the MLS (if any units), the actual condo inventory could be much higher.
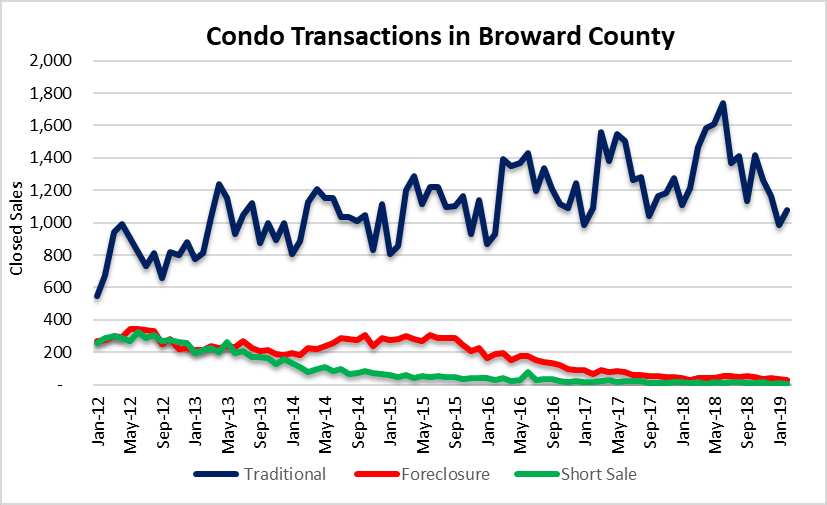
Deal volume in the condo market
There were 1,113 closed sales in Broward County during the month of February. This number is a 38% decline from the peak of 1,806 closings in June of 2018. Here is a breakdown by deal type during February:
- 1,077 traditional sales, down 22% from the peak in June
- 31 foreclosure sales, down 32% from June
- 5 short sales, down 73% from June
Condo property sale prices
This chart speaks volumes. You will see why we firmly believe that was the peak month for this cycle. It’s basically all down hill from there. The average sale price of a condo reached $264,975 in June. Since that peak it has declined 20% and was at $210,668 in February. If inventory continues to climb and transaction volume remains low, prices will remain under pressure as we move through 2019.
