Blog
Fort Lauderdale area residential price action & foreclosure activity
Today we will take a look at how the recent price action & foreclosure data looks when we drop the raw data into our charts. The charts speak for themselves, so we will limit the dialogue. First, let’s see how the average sale price of houses and condos look.
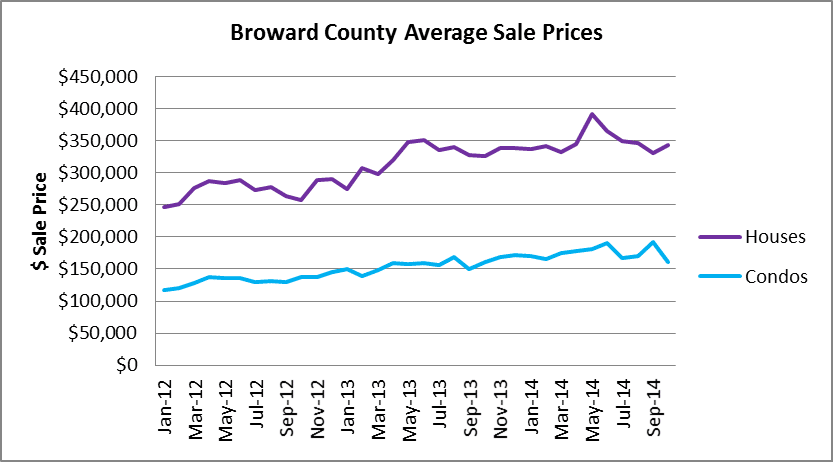
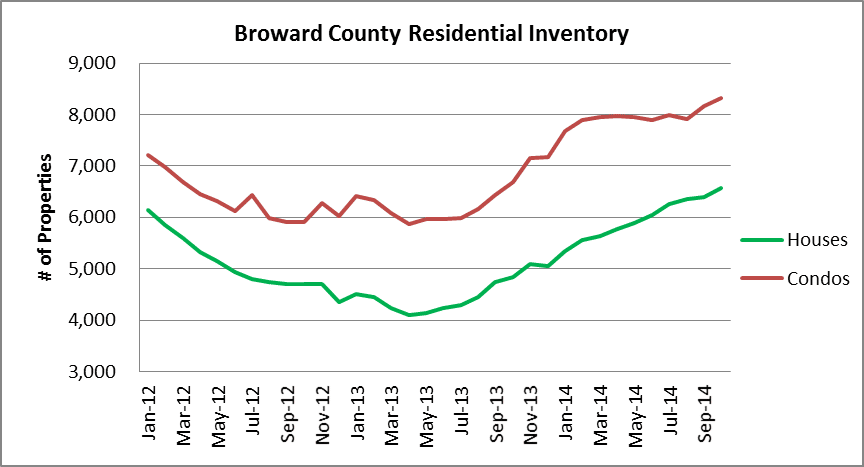
The slide in single-family home prices took a break in the month of November, with the average sale price at $342,797. That is a 12% decline from the peak in prices reached in the month of May. As for condo prices, they slid to $161,353 and that represents an 11% drop since May. As for the available inventory for sale, take a look at this next chart and you will see how the total available residential inventory has climbed 49% since it bottomed in April 2013.
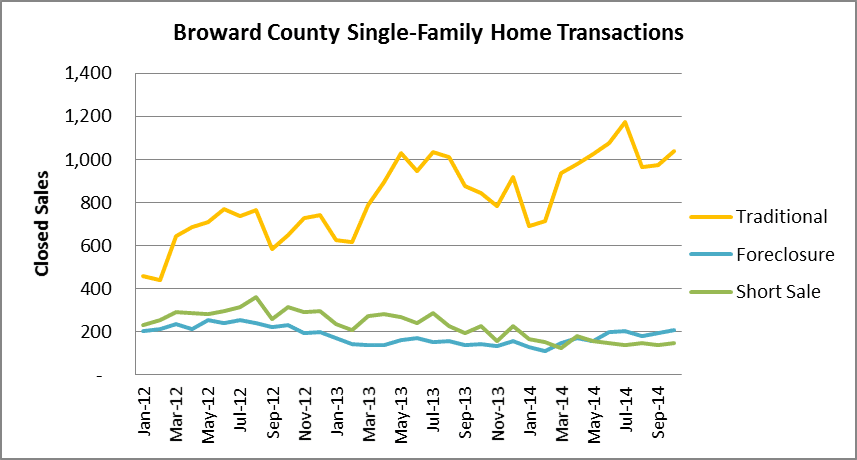
What types of transactions are closing? Here is a breakdown of single-family home sales.
As for the condo/townhouse transactions, here is a breakdown of the transaction types.
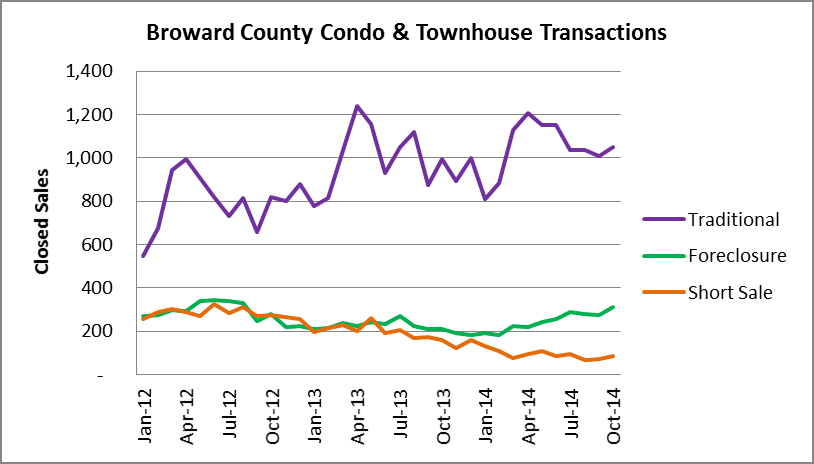
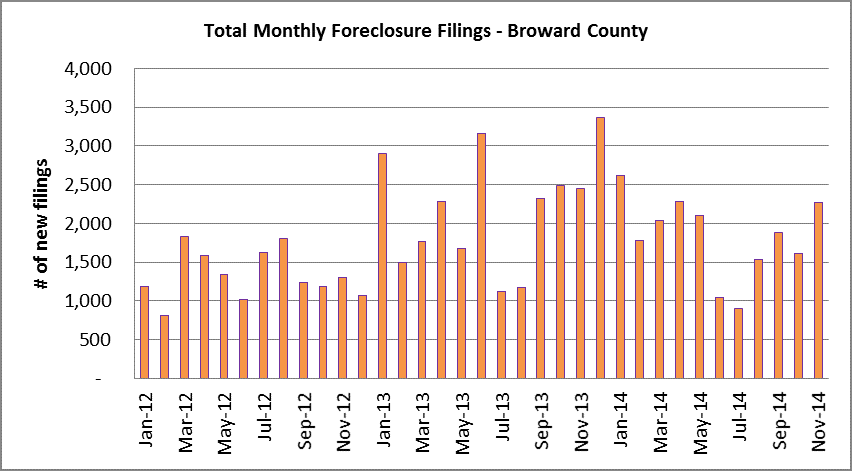
As for foreclosure activity, it appears to be picking-up into year end. For anyone who thinks that the distressed property overhang has cleared, think again. As long as this pace continues, residential property prices in the South Florida market will continue to be under pressure.
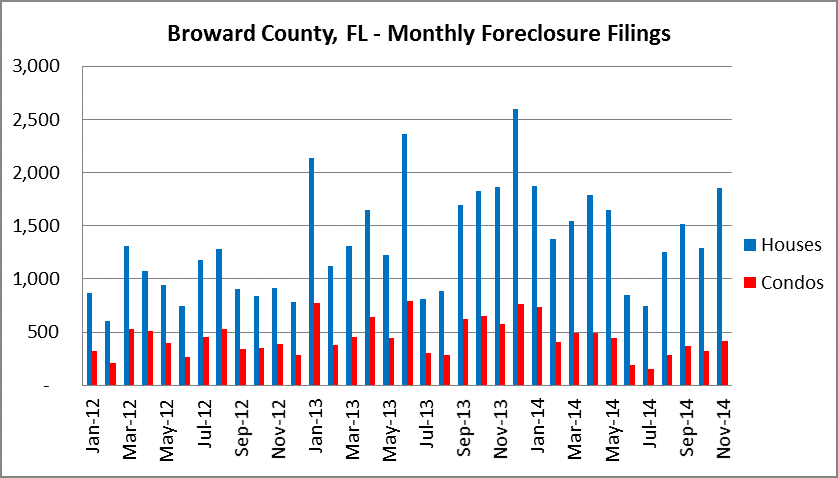
This is what the data looks like when you combine the foreclosure actions for houses & condos in Broward County.