Blog
As 2014 cruises along, here is a look at the Broward County residential real estate market
Today we will take a look at the charts and data for Broward County, Florida and see how the inventory, prices and the distressed property market are shaping-up. First, let’s look at the inventory of houses and condo/townhouse properties with data up until April.
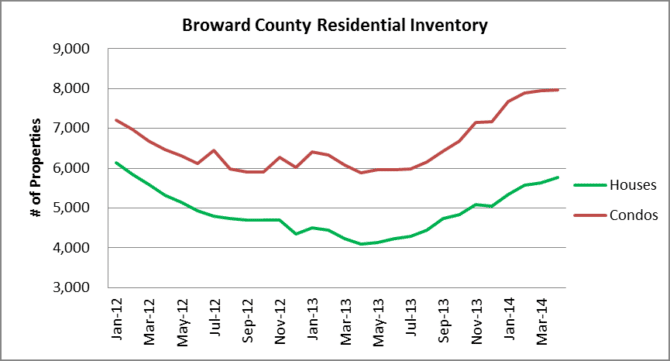
Residential inventory was climbing at a good pace after hitting a near-term bottom of 9,966 units listed last April. As of last month, there were 13,742 residential units listed for sale on the market in Broward County and that number represents a 38% increase year over year. Although the inventory only grew by a few hundred properties over the previous month, it still continues to climb. This may be a combination of property owners slowly emerging from a negative equity position and the addition of bank owned properties finally making their way to the market after spending years in hiding due to the robo-signing litigation against the major banks.
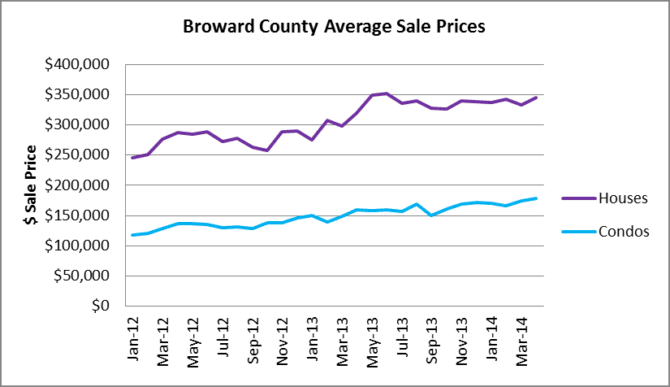
How do prices look? In April the average sale prices of houses and condos actually increased, with the average sale price of a house reaching $344,663 and the average sale price of a condo/townhouse property reaching $177,985.
The one issue that could throw a bucket of ice-cold water on all of the recovery talks in the news is the steady pace of new foreclosure filings. In April there were a total of 2,282 new foreclosure filings and that represents a 12% increase over March figures.
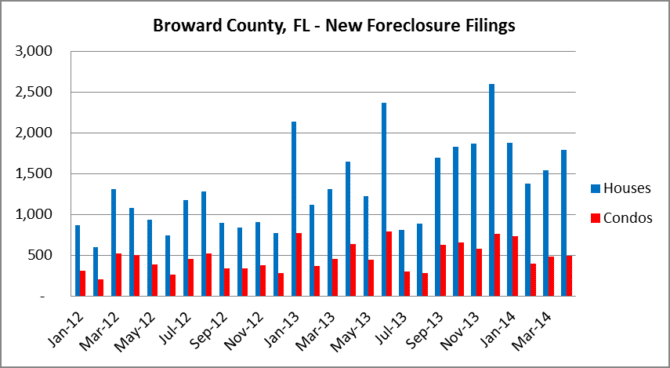
Foreclosure actions have increased each month after January. We saw a month over month increase for February, March and April and after getting a sneak peek at May data, the news isn’t getting any better. In 2012, the monthly average of new filings was 1,332. In 2013, the monthly average was 2,182 and so far in 2014, the monthly average is 2,177. Our guess is that after the data is released for May, we will surpass the 2013 average.
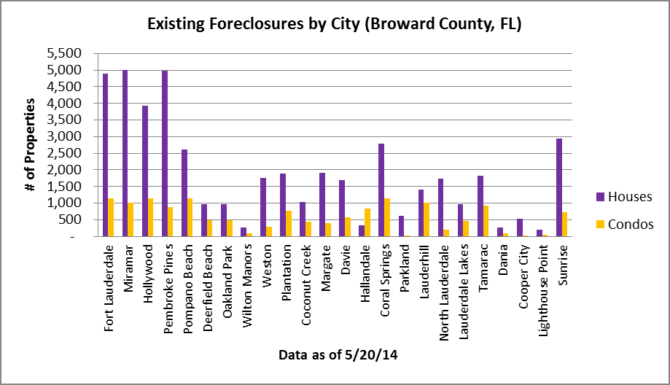
How about the shadow inventory of properties in foreclosure throughout Broward County? Here is a chart to show you where the roughly 60,000 residential foreclosures are located. Feel free to click on the chart to enlarge.
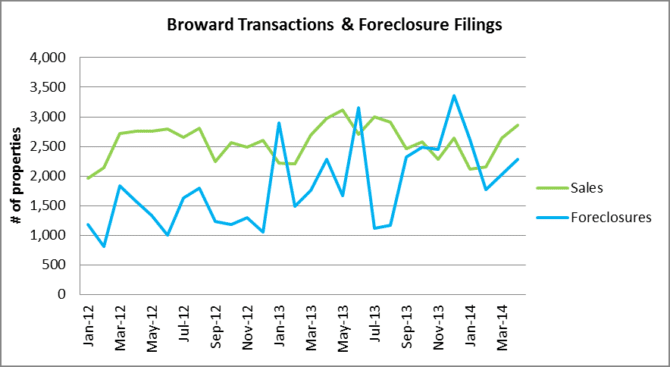
In order to add some perspective, we have included a chart to show the total number of transactions compared to the monthly foreclosure filings. At lease total sales are picking up and we can certainly credit the growing inventory for that. There have been some months where foreclosure filings surpassed the total transactions and that certainly will not help reduce the massive shadow inventory of properties in foreclosure throughout the Broward County area.