Blog
By the numbers: Miami-Dade, Broward & Palm Beach County residential market update
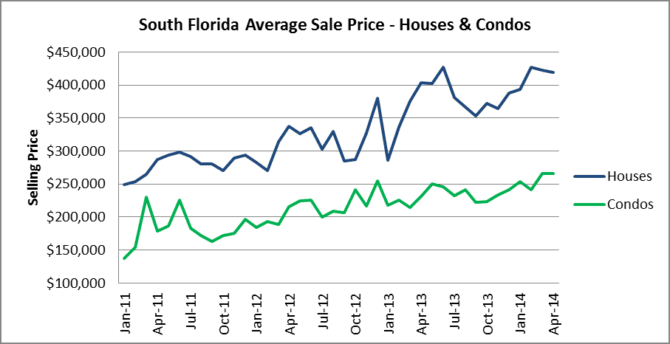
We have plenty of new data that has been dropped into our charts for the South Florida residential real estate market, so let’s get started. Our first chart today is of the average sale prices for houses and condo properties. In April, the average selling price of a single-family home in the tri-county area was $419,235, down a touch from $422,206 in March. The average sale price of a condo/townhouse property slipped to $265,634 down from $266,439 in March.
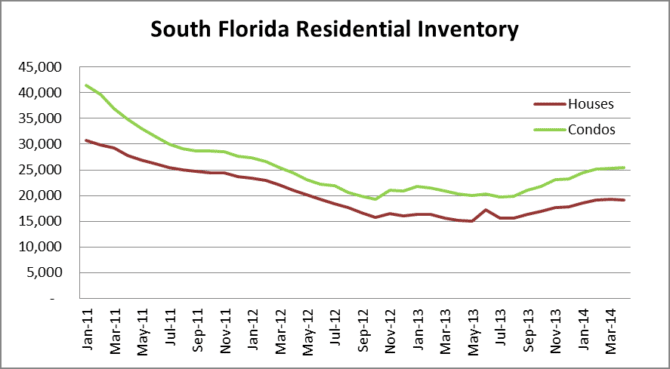
The gradual increase in the available supply may finally be putting a cap on prices. In April, the total number of houses and condo properties reached 44,573 (19.133 houses and 25,440 condo/townhouses) and inventory hasn’t been at this level since April 2012. Take a look at the far left of the inventory chart below and you will see how many properties dropped out of the available inventory just after the robo-signing litigation started in Late 2010. In January of 2011, there were 72,241 properties listed! Inventory dropped gradually and hit a bottom in October 2012 with 34,993 properties listed. In summary, by halting foreclosures for that period, inventory was cut in half and an artificial floor was created in prices. That is a lesson straight out of the fundamentals of economics: Supply and Demand. The craziest part is that the majority of those properties are still hanging around and have bounced in and out of foreclosure for the past six years. There are still roughly 140,000 houses and condos in foreclosure throughout the tri-county area, so the market still has several years to go to move the distressed inventory through the system. What would happen if you added even a fraction of the properties sitting in foreclosure to the available inventory? Even if you just put one-third of the properties stuck in the foreclosure process in South Florida on the market, the existing supply of properties for sale would more than double!
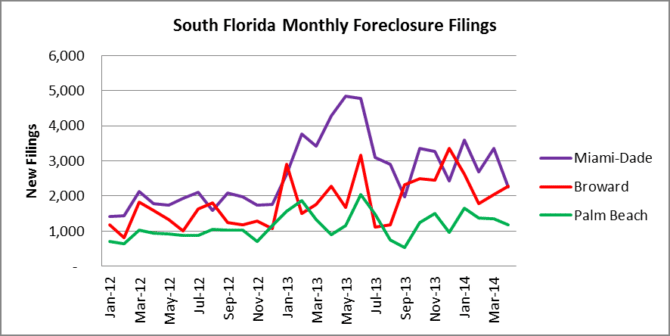
How about the pace of new foreclosure filings? Miami-Dade County filings have dropped significantly to only 2,251 new filings in April and Palm Beach filings have dropped for the past three months and slid to 1,189 in April. Broward County foreclosure filings started to climb again last month and reached 2,282 last month.
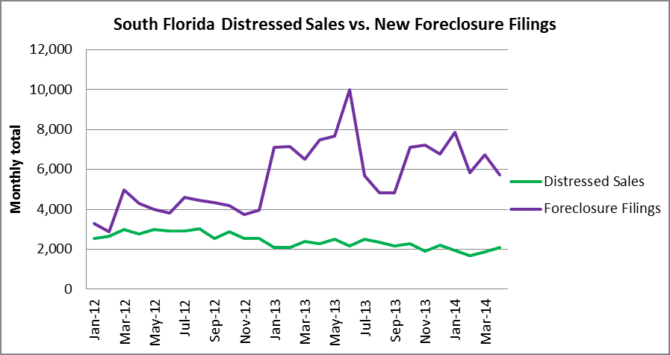
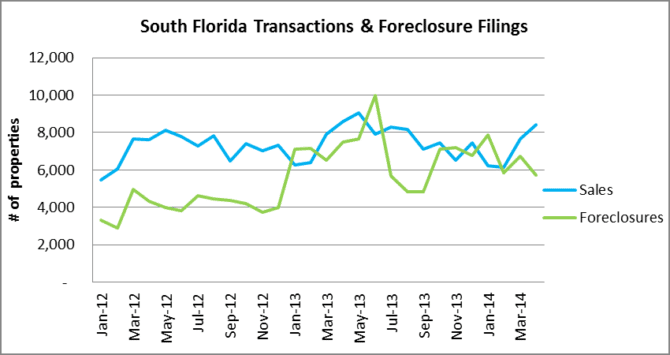
Now a quick look at the total number of sales vs. foreclosure filings. Now that inventory is on the rise, buyers have more properties to chose from and deals are getting closed. The distressed sales are still a much smaller percentage of all completed transactions and they will take time to come back since the average time to foreclosure in Florida is 935 days.
This last chart illustrates why the distressed properties will be hanging around for years. In April, there were 5,722 new foreclosure filings in the tri-county area and only 2,104 distressed sales. The distressed sales figure is a combination of short sales and bank REO transactions. Basically there were over two and a half times as many new foreclosure filings than distressed sales. If South Florida was to get the foreclosure problem under control, the pace of distressed sales (green line) needs to stay above the new foreclosure filings (purple line) for several years. Otherwise, we will just be kicking the can down the road, just as we have since 2008. We will update the foreclosure data in an upcoming blog post, so stay tuned!