Blog
Are mortgage rates ready to make a move higher?

One key component to the big move in housing prices has been historically low mortgage rates. There used to be a line in the sand at about 5% for residential mortgages where housing sales would slow and prices would begin to slide. We are a long way from that point right now, but any significant rise in rates could certainly put the brakes on this rally. If you watch our chart of the 15-year mortgage, 30-year mortgage and the 10-year bond yield, you should notice the correlation. The latest move in the 10-year bond yield could me signaling a longer term move higher in borrowing costs. It looks like this latest move in rates has already impacted loan demand. For anyone who bought a house in the last six months, there is a good chance you bought at the peak of the cycle.
House prices in South Florida
Here is a chart of the median sale price of single-family homes across the tri-county area of Miami, Broward/Fort Lauderdale, and Palm Beach. As you can see from the chart, they have been on a tear! That last upshot shows how much the COVID-19 pandemic boosted prices of traditional home sales as everyone wanted a house. During the month of May the median sale price of a house in a traditional sale was $375,000. In September it had reached $420,000. It was like musical chairs, but everyone grabbed a house when the music stopped. It’s almost like they didn’t care how much they paid.

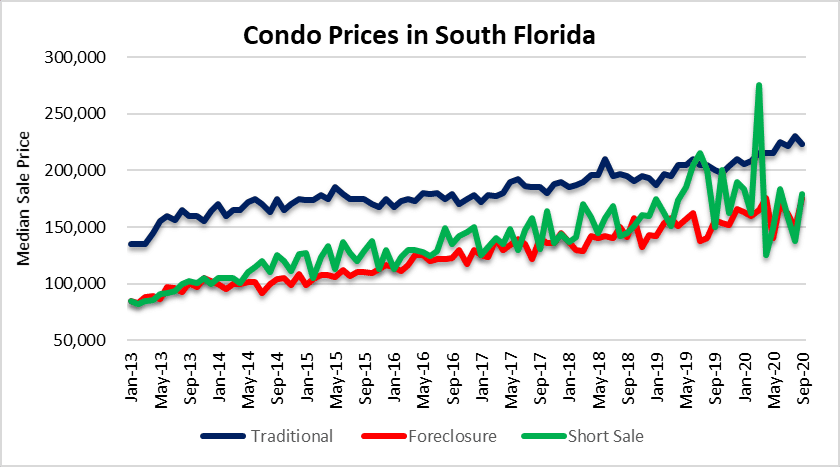
Condo prices in South Florida
Up next is a look at the median sale price of condo properties across the tri-county area. This segment of the market didn’t see the same level of excitement over the same period this spring/summer. In May the median sale price of a condo traditional sale was $215,000. In September that price had only moved up to $223,000. With limited supply of houses, maybe some demand will migrate to the condo segment as we finish 2020.
Real estate transaction volume
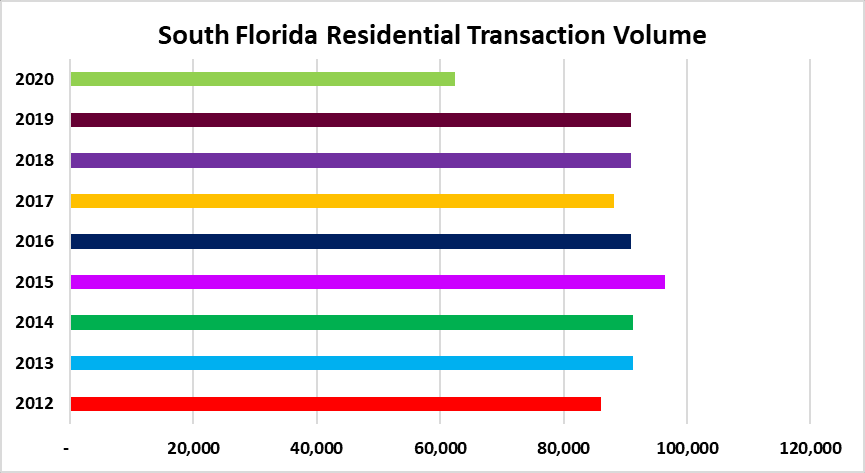
The number of transactions for 2020 is still far below prior years during this cycle. Here is a breakdown of the total sales from 2012-2020:
| Annual | Monthly Avg | |
| 2012 | 86,001 | 7,167 |
| 2013 | 91,180 | 7,598 |
| 2014 | 91,239 | 7,603 |
| 2015 | 96,411 | 8,034 |
| 2016 | 90,974 | 7,581 |
| 2017 | 88,227 | 7,352 |
| 2018 | 90,870 | 7,573 |
| 2019 | 90,864 | 7,572 |
| 2020 | 62,459 | 6,940 |
South Florida foreclosure activity
The pace of monthly foreclosure filings won’t pick up until 2021 since they have been on hold. Here is a chart of the monthly filings across South Florida. The chart is followed by a breakdown in the number of annual filings and monthly average.
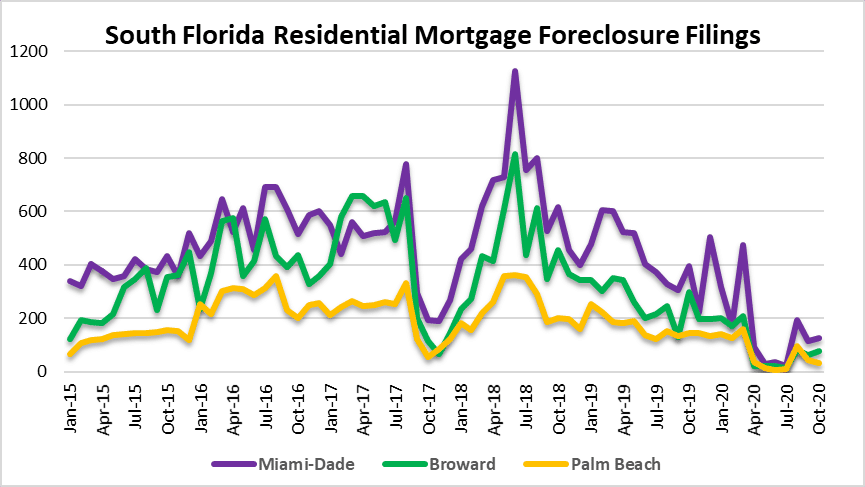
| Annual | Monthly | Change | |
| 2015 | 9,557 | 796 | |
| 2016 | 15,194 | 1,266 | 59% |
| 2017 | 13,071 | 1,089 | -14% |
| 2018 | 15,905 | 1,325 | 22% |
| 2019 | 10,355 | 863 | -35% |
| 2020 | 3,138 | 314 | -64% |