Blog
Charting the residential foreclosure activity & South Florida shadow inventory
Today we are going to chart the monthly foreclosure activity for Miami-Dade, Broward and Palm Beach County, Florida as well as show the shadow inventory of properties that are lingering in the foreclosure process. Our first chart of the day shows the monthly filings in the tri-county area.
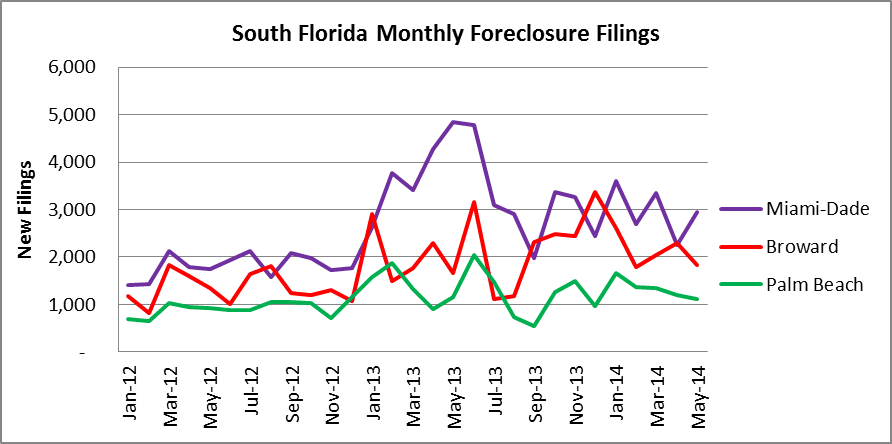
There were 5,877 new foreclosure filings in South Florida in the month of May, up slightly from 5,722 in April. Broward and Palm Beach saw filings drop for the month, while Miami-Dade saw an increase. As far as monthly averages, here is how they measure-up:
- In 2012, the monthly average of new filings was 4,053
- In 2013, the monthly average of new filings was 6,861
- So far in 2014, the monthly average of new filings is 6,408
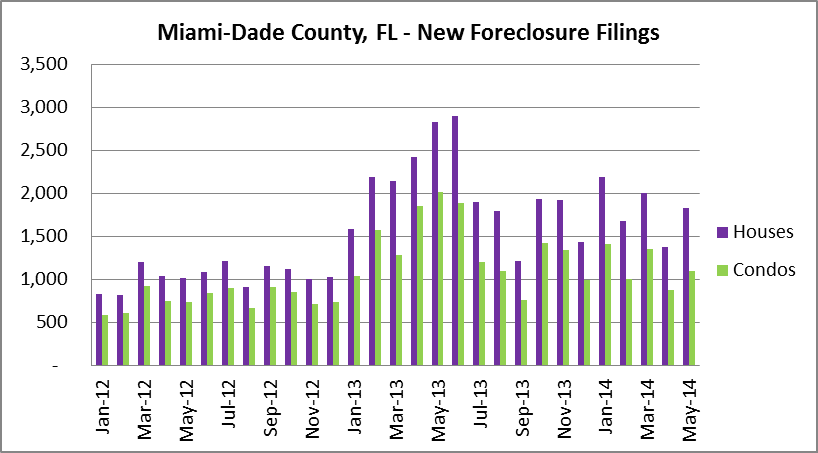
Let’s take a tour, starting from Miami-Dade County, then we will head North. In May, there were 1,831 new foreclosure actions filed in the single-family home segment in Miami-Dade and 1,105 condo/townhouse filings. There was a significant jump from 2,251 filings in April to 2,936 in the month of May. Feel free to click on the chart to enlarge.
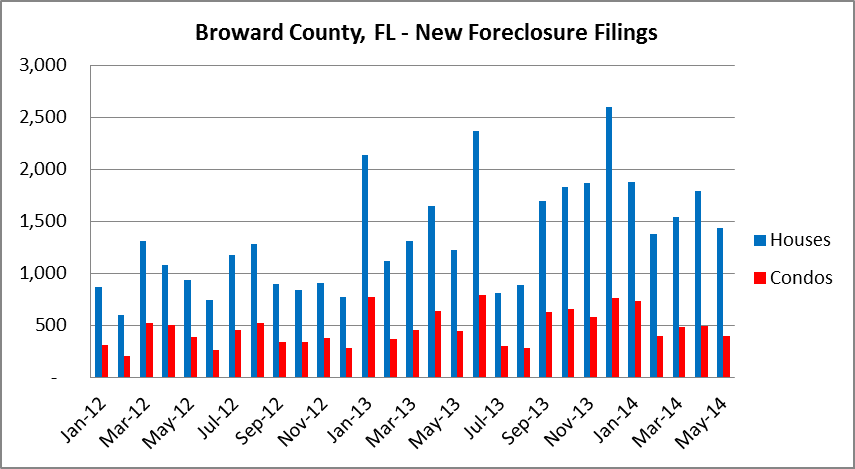
Let’s take a ride up A1A to Broward County, where 1,440 single-family homes and 397 condo/townhouse properties received a foreclosure notice in the month of May. The monthly total was 1,837 in May, down from 2,282 in April.
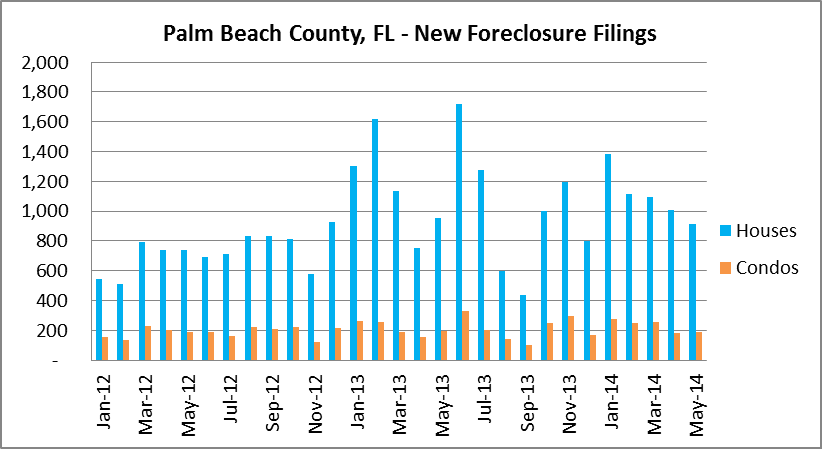
Now let’s keep cruising North to Palm Beach County, where the total of new filings was 1,104 in May, down from 1,189 in April. Out of the 1,104 filings, there were 913 filings in the single-family home segment and 191 in the condo/townhouse segment.
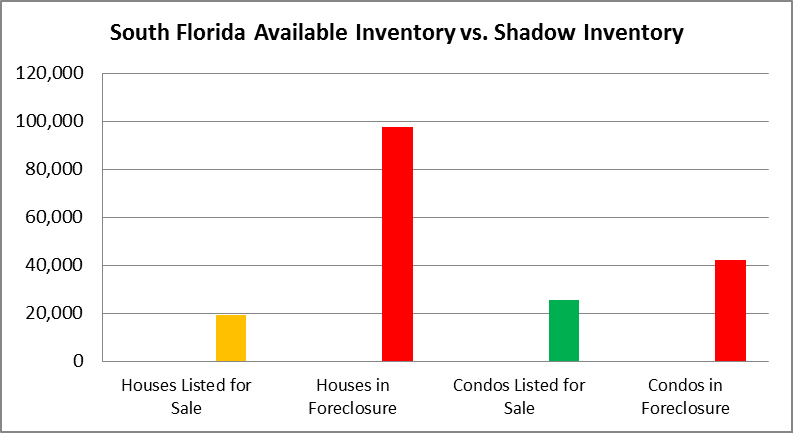
The pace of new foreclosure filings remains elevated throughout South Florida, especially for a market that is supposed to be in a “recovery”. What is more disturbing is the massive shadow inventory of properties in foreclosure throughout the area. We search city-by city throughout the South Florida market to compile our data, and this next chart is actually on the conservative side. If you read our blog on a regular basis, you have seen our breakdown by city and we will post an updated chart for each county very soon. For now, here is a snapshot of the South Florida residential properties in foreclosure:
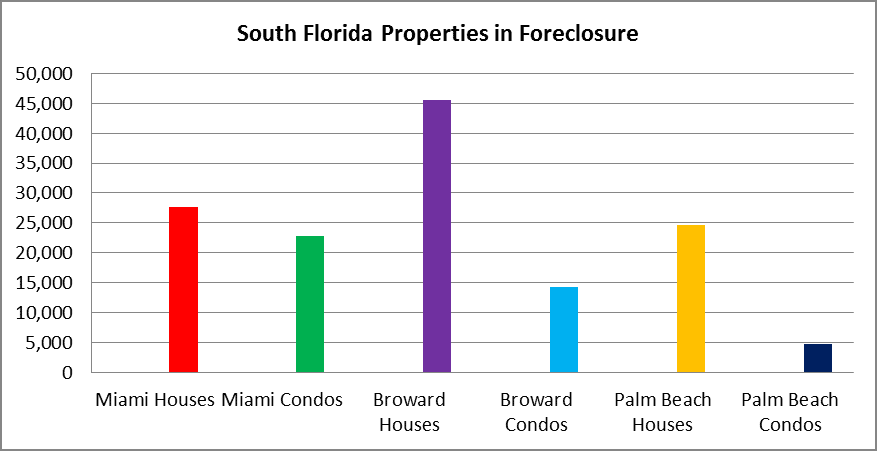
What most people don’t understand is that most of these properties have been in and out of the foreclosure process since 2008! They may be vacant, occupied by the previous owner, or even occupied by squatters without the bank even knowing (or caring). The distressed properties aren’t being sold at a fast enough pace to keep up with the pace of new foreclosure filings (please revisit our first chart). Finally, just to illustrate the massive gap between the properties currently listed for sale in South Florida and the properties that are in foreclosure, this last chart should be helpful: