Blog
Finally the temps cool off in the Ft. Lauderdale area and residential real estate prices should be next
After a year or more of limited inventory and rising prices, it looks as if the recent rally may bring some sellers out to test the market. First, lets look at the residential inventory in the Greater Fort Lauderdale area.
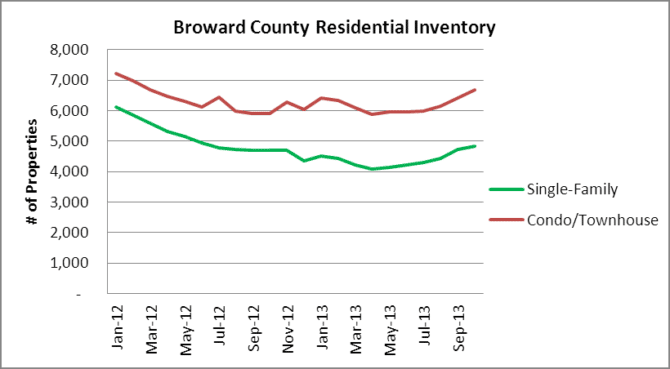
The single-family home and condo/townhouse inventory have been on the upswing since May and have climbed to 4,824 houses and 6,684 condo/townhouse properties listed for sale in Broward County in the month of October. Many potential sellers have been trapped in their homes with negative equity and are finally reaching a point where they can sell.
Next, let’s take a look at selling prices.
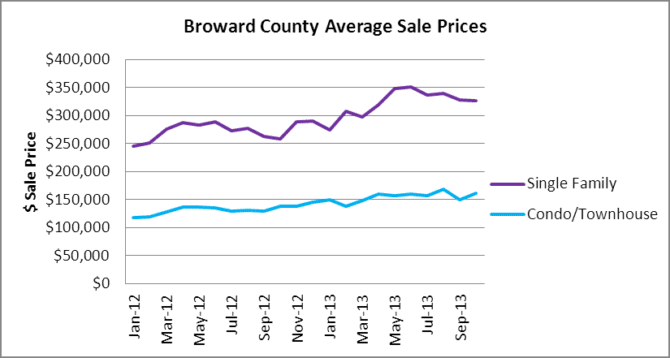
You will notice that the single-family home sale prices cooled-off once rates climbed from May to July. The borrowers who locked-in and got their deals closed did so at higher prices than transactions after July. Rising rates and increasing supply will continue to put downward pressure on prices going forward.
Are there any other factors that may cap residential real estate prices in the Greater Fort Lauderdale / Broward County area? Let’s see, the never-ending flow of new foreclosure filings in this next chart may create some problems:
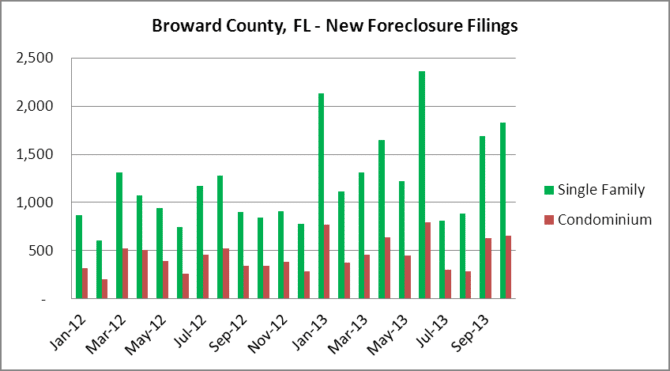
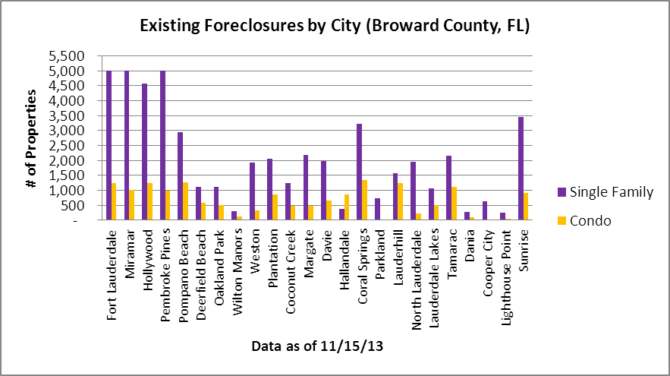
Somehow the media and the math-challenged real estate agents thought this mess was in the rear view mirror, when in fact it is just getting warmed-up again. In October there were 1,829 houses and 655 condo/townhouse properties that entered the foreclosure process. Keep in mind that this is a very long process in Florida, where the average foreclosure takes over 900 days to complete. Oh wait, don’t forget the over 50,000 houses and over 16,000 condo/townhouse properties that are still sitting in foreclosure throughout Broward County. Some are vacant properties being held off the market by the banks (aka zombie foreclosures), some are supposed to be vacant but have squatters in them and some of them have occupants that haven’t made a mortgage payment in 4-5 years but somehow remain in the property (aka vampire foreclosures). This shadow inventory has been growing month over month and most likely exceeds 70,000 properties now as our search results are limited to 5,000 properties in each property type. Several cities have already maxed-out over 5,000 houses in foreclosure. Feel free to click on the chart to zoom in on any cities of interest.
In order to further illustrate how inventory has been restricted, this next chart shows how many properties are listed for sale, listed as distressed (short sale or REO), compared to how many properties are in foreclosure.
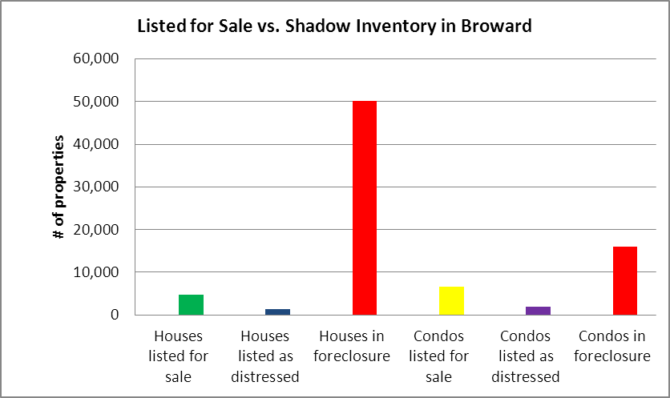
Hopefully by now you understand that the residential price increases witnessed from 2012 through the first half of 2013 were completely artificial and have created the housing bubble 2.0! Once again we have a noticeable disconnect from the fundamentals and this is not a true “housing recovery”, so you can put away the party hats. There is a massive shadow inventory of foreclosures that has been kept off the market since the robo-signing litigation started back in late 2010 and these properties have yet to make it back to the available inventory for sale. Over the next few years the banks will finally unload their inventory, but they will do so in a time of rising interest rates. Also, the banks will be competing with property owners who were previously underwater looking to finally sell and institutions that entered the residential market who have now realized that the REO to rental game isn’t generating the returns they expected. Stay tuned and we will keep our finger on the pulse of the market and relay more data (with some fun charts) soon.