Blog
Fort Lauderdale area house prices level-off while new & existing foreclosures remain elevated through October
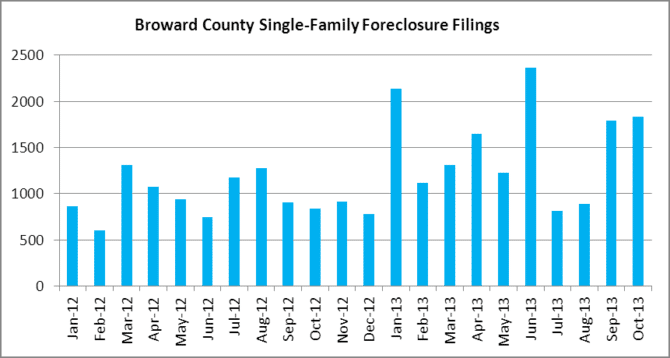
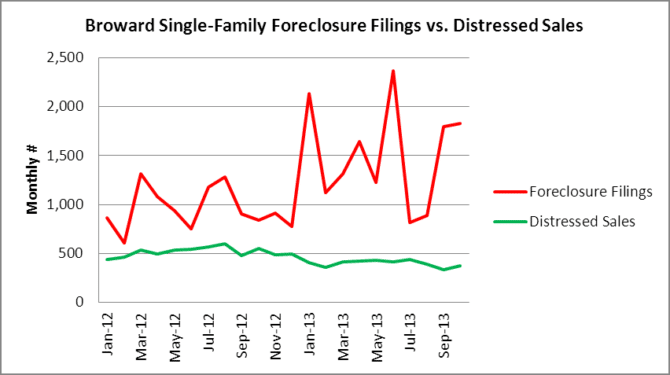
From the looks of the October single-family home data in Fort Lauderdale area single-family homes, it looks like another month of adding distressed properties to the already massive shadow inventory of foreclosures. There were 1,829 new foreclosure filings in October and only 370 distressed sales when you combine the short sale and REO transactions.
There is no surprise that the massive shadow inventory of foreclsoures throughout Broward County continues to grow. This next chart is a city-by-city tour of where over 50,000 distressed properties are located throughout the county.
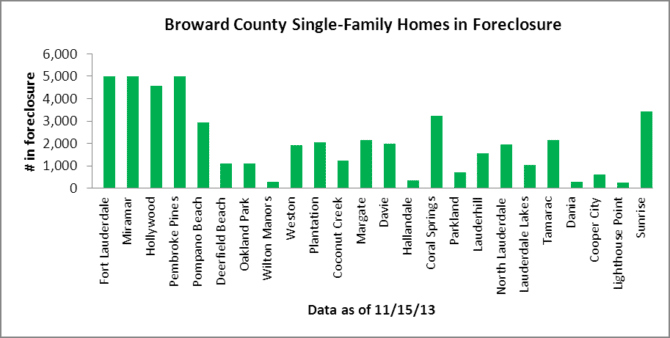
Feel free to click on the chart for better clarity, but here area a few of the chart-leading cities:
- Fort Lauderdale has over 5,000 houses in some stage of foreclosure
- Miramar has over 5,000 houses in some stage of foreclosure
- Pembroke Pines has over 5,000 houses in some stage of foreclosure
- Hollywood has 4,574 houses in some stage of foreclosure
- Sunrise has 3,446 houses in some stage of foreclosure
- Pompano Beach has 2,941 houses in some stage of foreclosure
- Coral Springs has 3,232 houses in some stage of foreclosure
Once again, these numbers are just for single-family homes, not including over 16,000 condo/townhouse properties in foreclosure throughout the county. Also, when we say “over 5,000”, our search results are limited to 5,000 properties at a time, so there actual numbers may be much higher. When we quote shadow inventory figures, our numbers are actually on the conservative side which means this problem is worse than our charts show.
What types of transactions are closing?
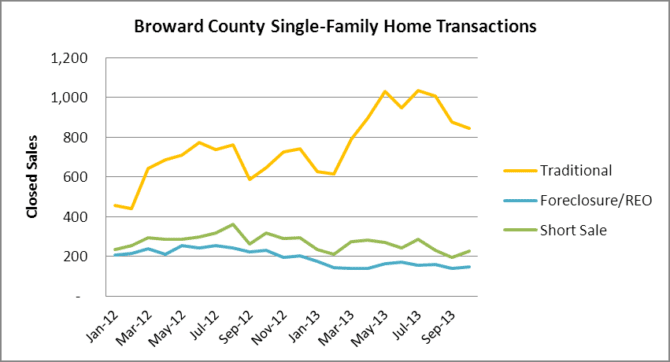
Out of 1,214 houses sold in October, the breakdown of closings was as follows:
- 844 were traditional sales and accounted for roughly 70% of all closings
- 145 were foreclosure / REO sales that accounted for 12% of all closings
- 225 were short sale transactions that accounted for 18% of all closings
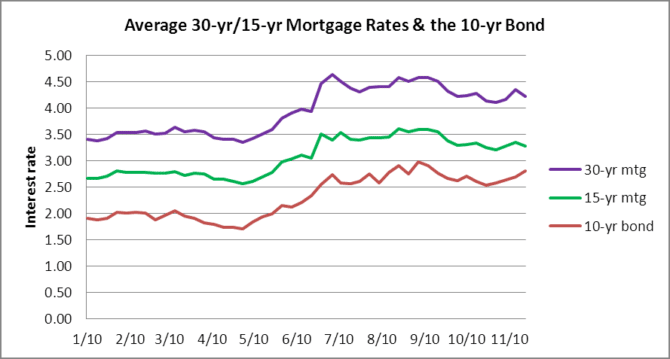
It’s worth noting that tradtional sales have been sliding over the last few months. They reached 1,036 in July and have dropped 18.5% to only 844 in October. This is most likely attributed to the interest rate increases. Take a look at this last chart and you will see that rates climbed from May to July. The transactions that closed by July most likely had locked in their rates in advance and the deals in the pipeline either didn’t close or maybe even closed at lower prices. Rates aren’t finished going up. Just look at the 10-year bond rate in red and the recent uptrend. That will result in higher mortgage rates this week and if the 10-year gets above 3% there is a loud message to housing prices: Look out below!
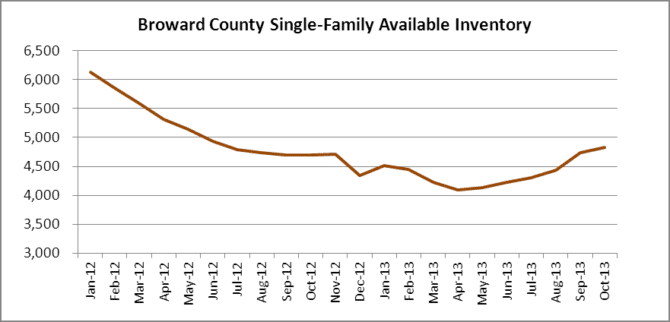
Just a few more charts and we will wrap things up. The inventory of houses listed for sale is finally on the rise. This is because the short-term increase in prices brought some sellers out to test the market. Some of these sellers couldn’t sell for the past 5 years or so because prices have been depressed. Inventory has increased from 4,089 in April to 4,829 in October, which represents an increase of 18% in listed properties.
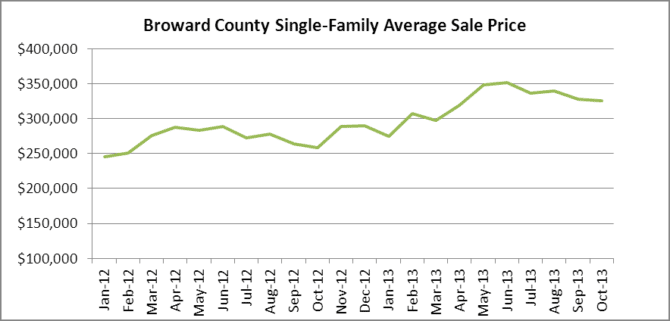
The average selling price dropped to $326,072 in October after reaching a short-term high of $351,439 in June. It is obvoius from the chart that deals that were completed in June were able to sneak to the closing table at lower borrowing costs before the rates put downward pressure on prices.
O.K., just one more chart and this is for the people that keep saying that we are beyond the foreclosure mess. This last chart shows the monthly foreclosure filings for single-family homes in Broward. There were 1,829 new filings in October, up from 1,794 in September.