Blog
Loan defaults at a glance
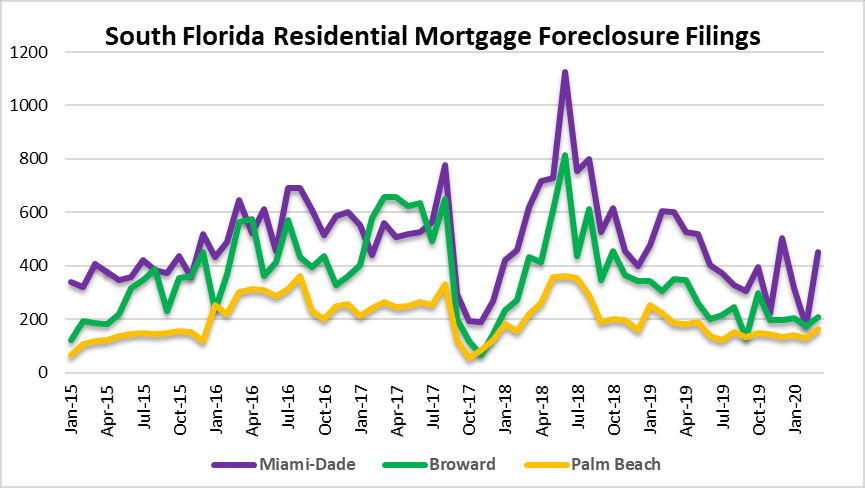
Today’s charts are a look at loan defaults across South Florida through the month of March. Nobody knows how deep the recession may be this time and how it will impact housing. There have been some dire predictions so far, but nobody really knows. We will look at the number of monthly foreclosure filings in Miami, Broward / Fort Lauderdale and Palm Beach residential markets. With the exception of a few active months, they have remained tame. As of our last market outlook, real estate prices remained strong (at least in the single-family home segment) and inventory was low.
Loan defaults in Miami

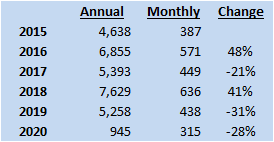
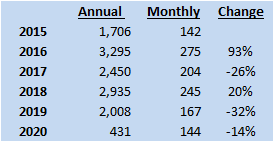
Keep in mind that this chart stops before the impact of the pandemic, so this is a snapshot in the rear view mirror. The highest point of this chart looks like it was in June of 2018, when there were 749 new foreclosure filings on houses in the Miami area and 378 condo filings for a total of 1,127. It’s worth noting that foreclosures were halted for the 4th quarter of 2017 due to hurricane Irma, so that’s why they ramped-up in the spring of 2018. March 2020 had a total of 452 condo and house filings, up from only 176 in February. During the last cycle, the Miami area cities with elevated foreclosure activity were Hialeah, Homestead, City of Miami and Miami Gardens. Here is a look at the annual totals, monthly averages and year over year changes since 2015:
Greater Fort Lauderdale area

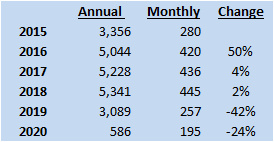
Once again, the only elevated foreclosure activity activity in the Fort Lauderdale looks like it was the spring of 2018 after new filings had been frozen for awhile. If you simply back-filled the chart it would be smooth sailing over the past 5-6 years. During the last cycle, some cities with elevated foreclosure activity in the Fort Lauderdale area included Coral Springs, Hollywood, Pompano Beach, Miramar and Pembroke Pines to name a few. Here is a snapshot of the numbers since 2015:
Palm Beach market
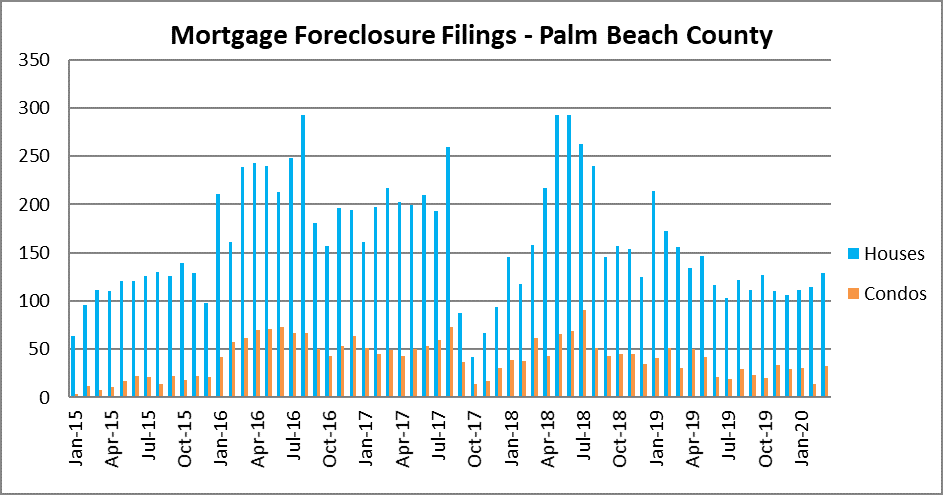
The third time is a charm. You will notice once again that the only period of elevated foreclosure activity in the Palm beach County market was the spring of 2018 after foreclosures were halted. There has been a gradual increase each month in 2020, with a total of 162 filings in March, up from 128 in February. That’s still very low, since it combines both houses and condos. During the last cycle, some of the areas with higher foreclosure activity included West Palm Beach, Lake Worth, Boca Raton, Delray Beach and Boynton Beach.
Finally, here is a chart of all three South Florida together with their monthly foreclosure filings combined.

This real estate market outlook covers real estate activity in Miami-Dade, Broward and Palm Beach County, Florida. Here are just a few of the cities in each of these three markets:
- Miami-Dade – Aventura, Coral Gables, Miami Beach, Hialeah, Sunny Isles Beach, North Miami, Homestead, Doral, Miami Lakes, Downtown Miami, Brickell and Key Biscayne.
- Broward – Fort Lauderdale, Pompano Beach, Deerfield Beach, Hollywood, Hallandale, Weston, Parkland, Wilton Manors, Oakland Park, Plantation, Cooper City, Davie, Coral Springs, Sea Ranch Lakes, Lauderdale by the Sea and Lighthouse Point.
- Palm Beach – Delray Beach, Highland Beach, Jupiter, Palm Beach Island, Boynton Beach, Boca Raton, Highland Beach, Palm Beach Gardens, West Palm Beach, Wellington and Lake Worth.