Blog
Follow you down
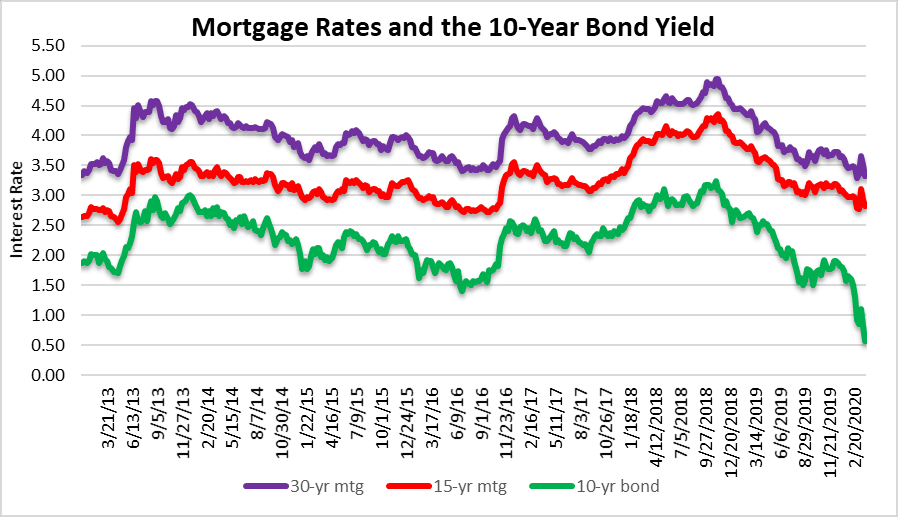
Looking at this chart of mortgage rates and the 10-year bond yield reminds me of that Gin Blossoms song “Follow you down.” What’s crazy is that song was released back in 2009 when the last housing bubble was popping. We have discussed previously that even within bond yields sinking to new lows, mortgage rates may not follow them down all the way. A lender is still assuming risk when underwriting new loans and they need to be compensated for that risk. All of the charts today are looking in the rear view mirror, so they are no prediction of where sales volume and prices are headed. Our guess is that the median sale prices of traditional transactions and distressed sales may end up meeting in the middle of the chart somewhere over the next year or two. It shouldn’t take long to see if this past decade of “recovery” in the housing market is fact or fiction..
Median sale prices – South Florida houses
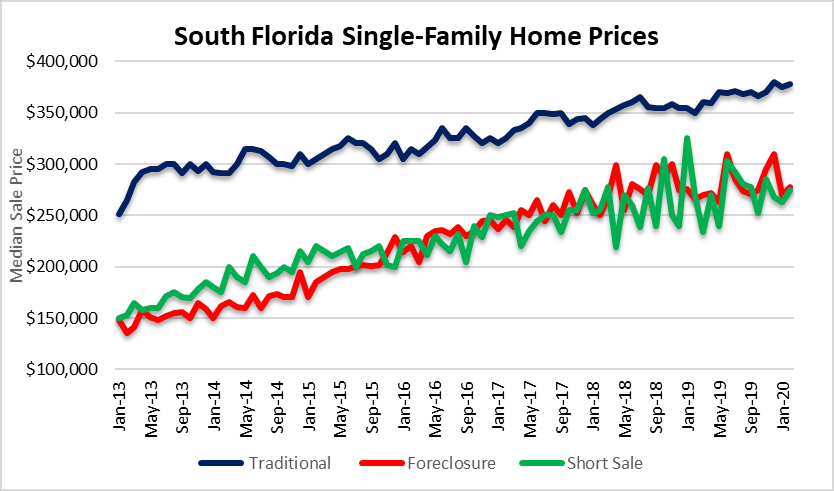
You will notice the smooth, upward trajectory of house prices since the last crisis. Short sale and foreclosure prices have been somewhat lumpy over the past few years, since they have been declining in numbers and fewer sales have caused greater movement in the prices. Here is a snapshot of the February 2020 numbers:
- Traditional sales – $378,000, up from $375,000 in January
- Foreclosure sales – $277,450, up from $270,000 in January
- Short sales – $275,000, up from $262,500 in January
Median sale prices – South Florida condos
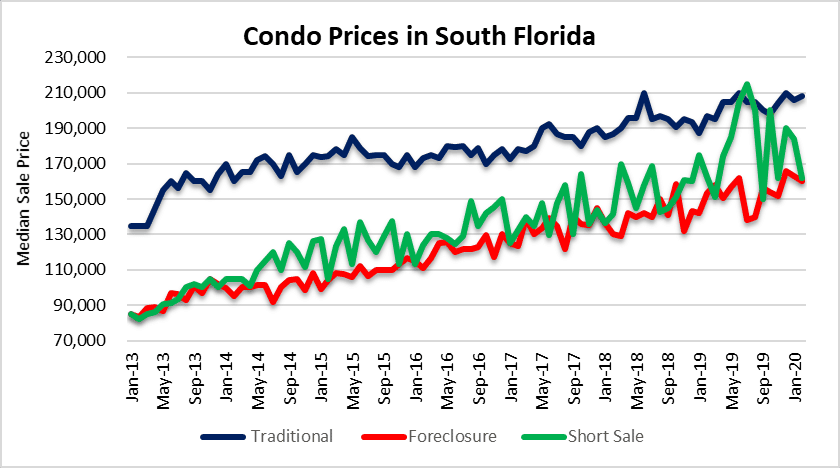
Once again, looking at the traditional sales of condos in South Florida, there has been a smooth, steady incline in the chart of prices. Prepare for this chart to get disrupted as well. Here is a look at the recent numbers:
- Traditional sales – $208,000, up from $206,000 in January
- Foreclosure sales – $160,000, down from $162,950 in January
- Short sales – $162,000 down from $184,00 in January
South Florida real estate sales – follow you down
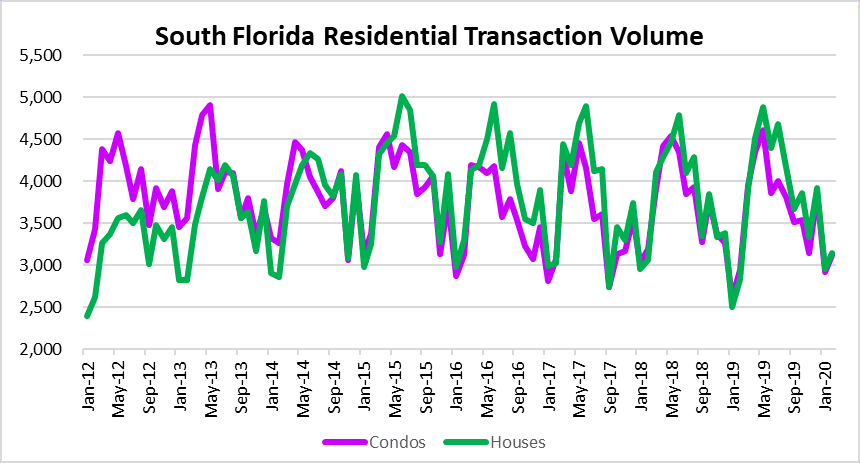
There was a slight uptick in residential real estate sales in February over the January numbers. Don’t expect that to last much longer as sales will most likely be impacted going forward. The latest news from the job market won’t be much help. It would not be a surprise to see less than 2,000 closed sales per month at least through the summer.
- Single-family transactions – 3,121 in February, up from 2,920 in January
- Condo transactions – 3,148 in February, up from 2,957 in January
This real estate market outlook covers real estate activity in Miami-Dade, Broward and Palm Beach County, Florida. Here are just a few of the cities in each of these three markets:
- Miami-Dade – Aventura, Coral Gables, Miami Beach, Hialeah, Sunny Isles Beach, North Miami, Homestead, Doral, Miami Lakes, Downtown Miami, Brickell and Key Biscayne.
- Broward – Fort Lauderdale, Pompano Beach, Deerfield Beach, Hollywood, Hallandale, Weston, Parkland, Wilton Manors, Oakland Park, Plantation, Cooper City, Davie, Coral Springs, Sea Ranch Lakes, Lauderdale by the Sea and Lighthouse Point.
- Palm Beach – Delray Beach, Highland Beach, Jupiter, Palm Beach Island, Boynton Beach, Boca Raton, Highland Beach, Palm Beach Gardens, West Palm Beach, Wellington and Lake Worth.