Blog
Market wrap: Greater Fort Lauderdale area residential inventory, transaction types & prices
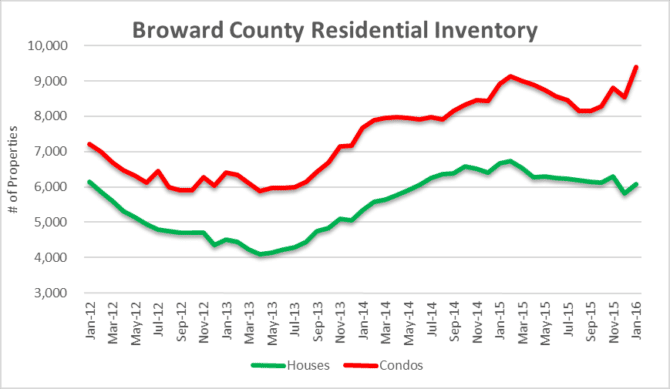
Today we are going to review some of the recent data for the Greater Fort Lauderdale area, including existing inventory, transaction types and prices. First, we will take a look at the available inventory of residential properties. There were 15,486 residential properties listed for sale in the month of January. This is a level we haven’t seen in several years. There were 6,086 single-family and 9,390 condo properties on the market. Usually there is a seasonal impact to the January data because property owners often remove their properties from the market during the holidays and relist in January. We always say that one month doesn’t make a trend, but with condo inventory climbing to multi-year highs, this could be an issue as we move though 2016.
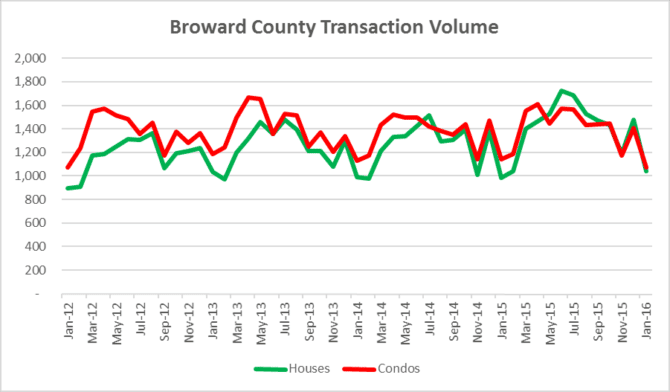
You will notice from our next chart that transaction volume throughout Broward County dropped again. The 2,117 closings in January was a decline of 7% from December when there were 2.885 closings. Simply put, it may be difficult for prices to remain at existing levels with the rising inventory and declining sales volume.
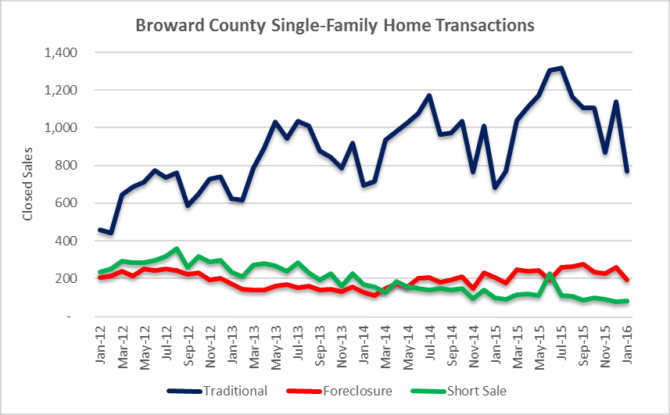
Now, let’s breakdown each segment of the market, with a look at single-family homes by transaction type. The deal volume in traditional sales got crushed by 32% in January! Meanwhile, foreclosures declined 26% and short sales declined a modest 3%.
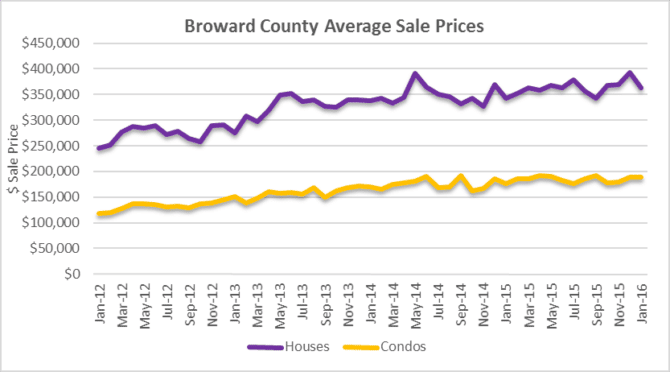
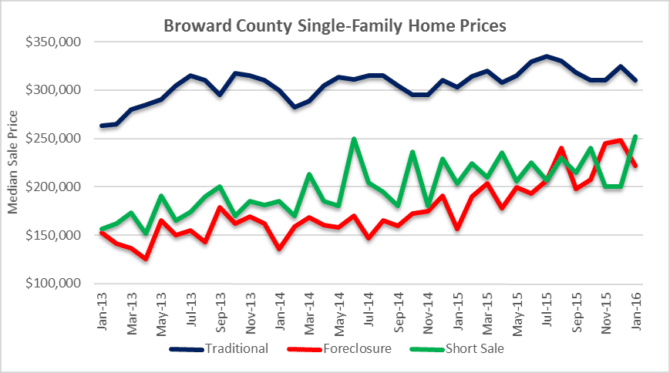
As for the median sale prices by transaction type:
- There was a slight dip in the median sale price of traditional sales, where prices dropped to $310,000 in January from $325,000 in December
- Foreclosure prices dropped from $248,000 in December to $222,000 in January
- Short sale prices actually climbed from $200,150 in December to $252,000 in January
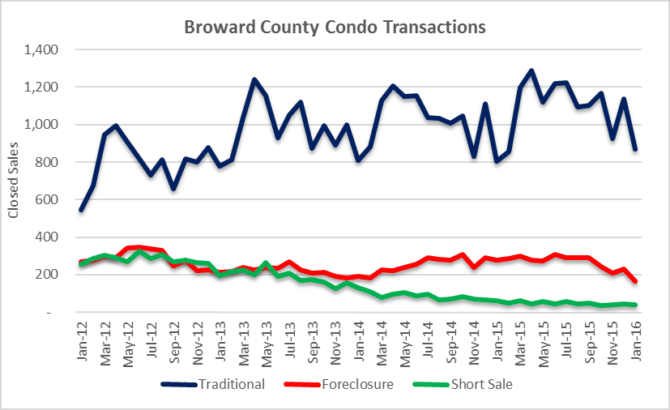
Now a look at condo transactions, where the total deal volume declined 24% in January:
- Traditional sales dropped from 1,138 in December to 870 in January
- Foreclosure sales dropped from 228 in December to 164 in January
- Short sale transactions dropped from 43 in December to 39 in January
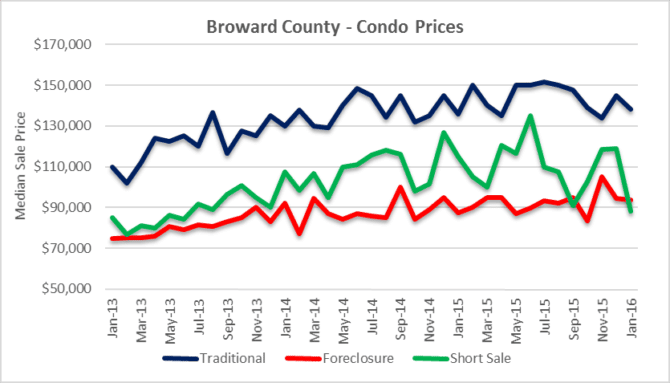
As for the median sale prices of condo properties, traditional sales and foreclosures held up fairly well, but short sale prices showed a sharp decline. With available inventory climbing, it will be interesting to see if these prices are sustainable. Rising supply coupled with declining transaction volume is usually followed by a decline in prices.
What’s funny is that last spring we called a top in South Florida prices during the month of May. There was a brief rally over the summer months, but if you look at the average sale prices, we are still down 7% in houses and 5% in condo properties since May. Stay tuned, this could get interesting!