Blog
A quick look at the single-family home market in the Fort Lauderdale area
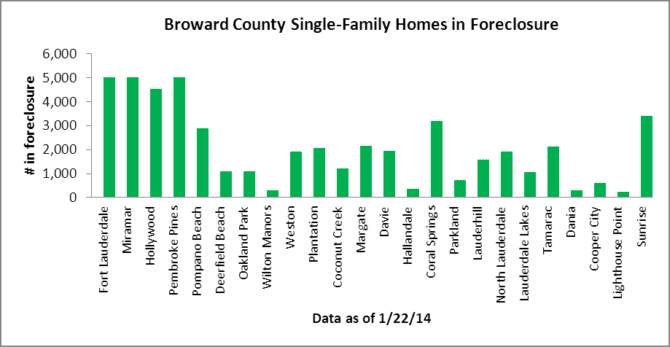
As we wait for the January residential inventory, transaction and price data, we will take a quick look at the state of the single-family home market through the end of 2013 and a quick glance at the foreclosure numbers for January 2014. There was another article in the local paper about the strong housing recovery, so maybe some actual facts and figures will help calm the enthusiasm. Our first chart today is a snapshot of the 50,000 +/- single-family homes in foreclosure throughout Broward County. This is just the houses and does not include condos, townhouses, multi-family properties, etc.. Feel free to click on the chart to see where each city ranks. (Pro-tip: The ones showing 5,000 houses in foreclosure have exceeded our 5,000 property limit).
Our next “housing recovery” chart shows the pace of new foreclosure filings in Broward County. December 2013 was a big month for Broward foreclosures and the numbers settled down a bit in January.
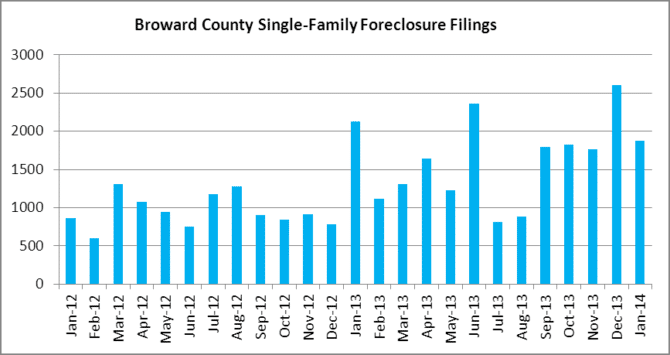
Just a few notes on the new foreclosure filings data:
- In 2012, the monthly average of new foreclosure filings (for houses only) was 953.
- In 2013, the monthly average of new foreclosure filings (for houses only) was 1,624, representing a 59% increase over 2012.
- In January 2014, there were 1,877 new foreclosure filings (for houses only), representing a 16% increase over the 2013 monthly average.
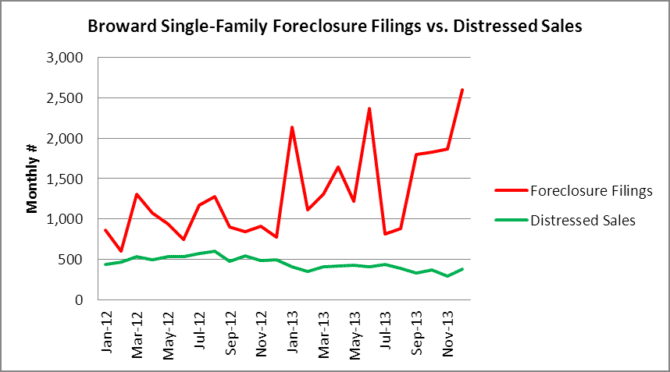
Our next chart clearly shows why there will continue to be a massive shadow inventory of foreclosures in the Broward County area for at least the next few years. In December, there were 2,602 new foreclosure filings in the single-family home segment in Broward, but only 382 distressed sales. Distressed sales are short-sale or foreclosure/REO transactions. With nearly seven times as many foreclosures as distressed sales, the already swollen shadow inventory of
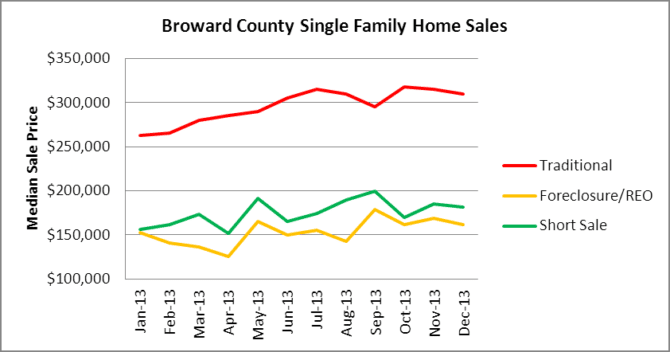
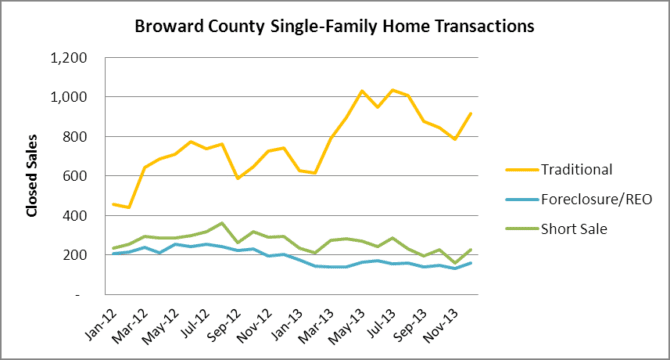
Now let’s take a look at all of the closings in the single-family home market through December 2013. There was a slight uptick in short sales as the mortgage debt relief act expired at the end of the year and sellers rushed to close their short sale transactions so they won’t get tax on the forgiven debt.
As for the median sale price for each transaction type, our last chart today shows the wide gap in selling price between a traditional sale and a short sale or REO transaction. Needless to say, once the over 50,000 houses in foreclosure start hitting the market, there may be some pricing headwinds.