Blog
South Florida Foreclosures: Don’t call it a comeback, they’ve been here for years!
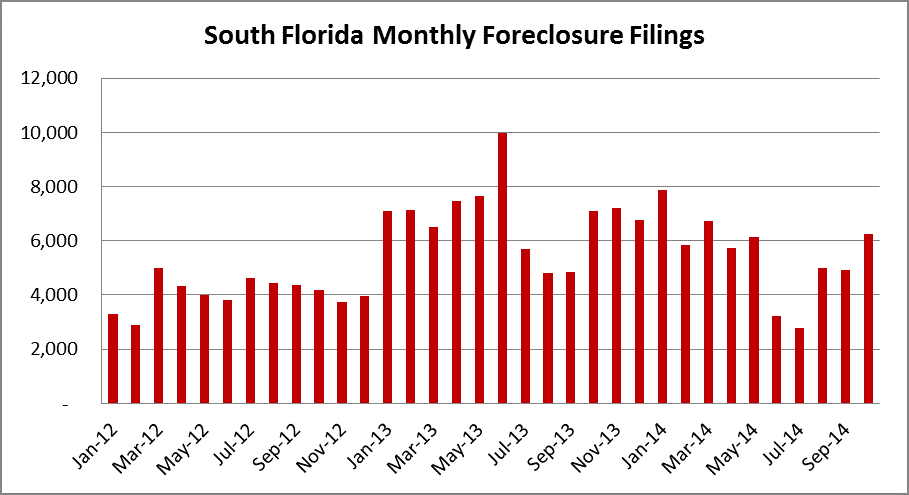
The South Florida foreclosure problems are far from over. Nearly six years after the housing bust we are still wrestling with properties in default. The steady flow of distressed properties in this market will continue to be a problem over the next few years. The good news is that all of these monthly filings aren’t new properties entering the foreclosure process, but are the banks finally setting auction dates and repossessing properties that have been in and out of foreclosure for the past 4-6 years. The total number of filings during the month of October for Miami-Dade, Broward and Palm Beach climbed 27% from September to 6,238 foreclosure actions.
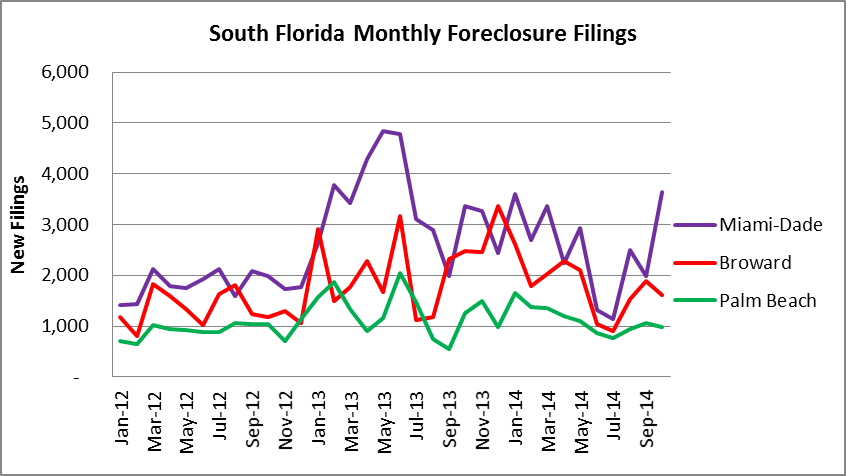
As for a breakdown by County, take a look at this next chart. You will see that Miami-Dade had a busy month with a total of new 3,639 filings, up from 1,978 in September. Broward County dipped slightly from 1,884 in September to 1,611 in October and palm Beach dropped from 1,067 in September to 988 in October.
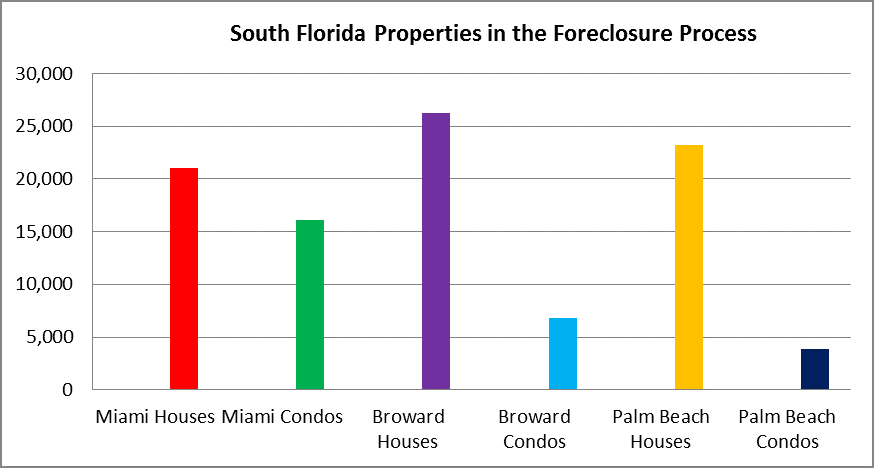
Why are the monthly filings still elevated? When you combine the existing foreclosures with the new filings, there is still a hefty shadow inventory of distressed properties throughout South Florida. We conduct a city by city search of each county to get the totals for the next chart. The Miami-Dade numbers may appear low because our searches are capped at 5,000 properties for each property type and the City of Miami exceeds the cap.
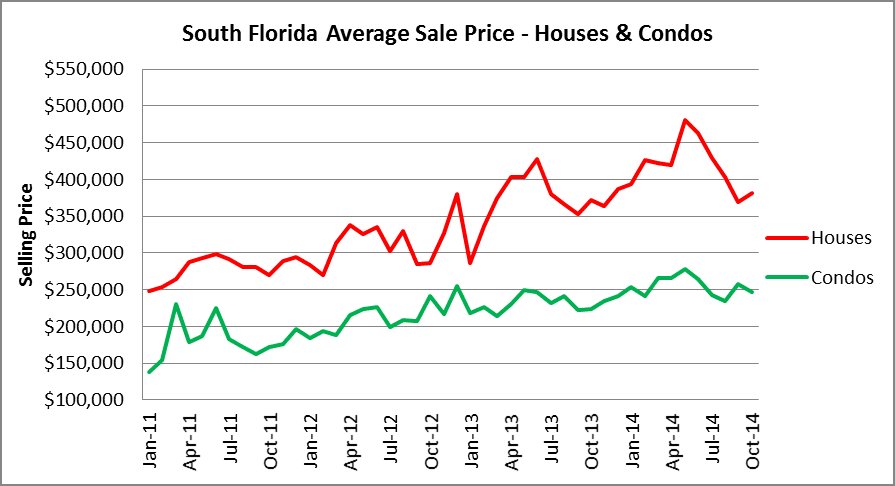
Do you think that a steady dose of distressed properties will impact prices going forward? Our last chart today shows that single-family home prices took a rest from their drop in October, but we will see what unfolds as we head into 2015.
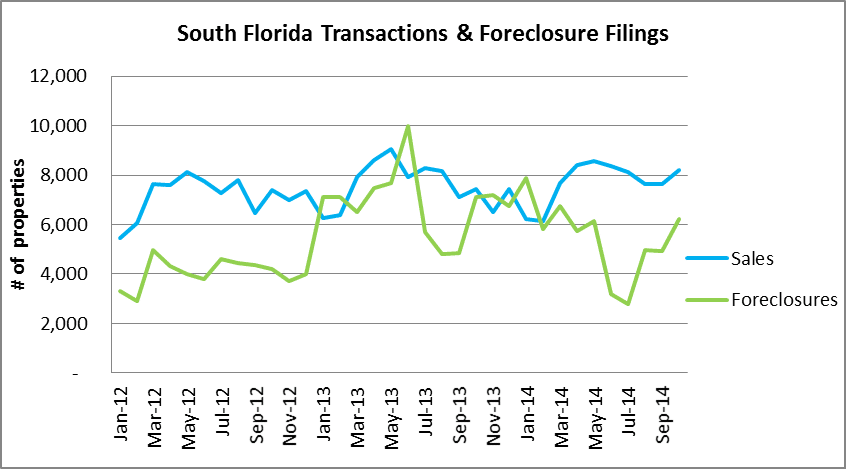
Finally, just to put the volume of transactions compared to the amount of foreclosure actions into perspective, we have dropped the data into one final chart that illustrates the trend: