Blog
That first shot of humidity
Well, it finally hit us this week. That first shot of humidity arrived, letting us all know that summer is here. Even before the weather changed, it seems like something is different in the residential real estate market. Stale listings are all over the place. What happened to all the people that were supposed to be flocking here due to changes in the SALT Deduction?
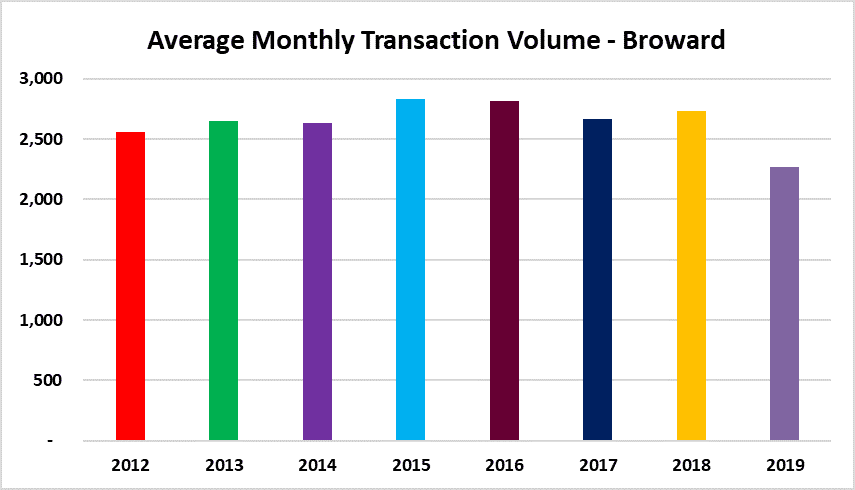
Average Monthly Transaction Volume
Deal volume remains slightly below average so far in 2019. This chart just includes closed sales through the month of March. Right now we are down 17% from 2018 sales volume on a monthly basis. In 2018 there was an average of 2,733 per month and 2019 stands at 2,266. The first quarter is seasonally sluggish, so an active second quarter may help the average.
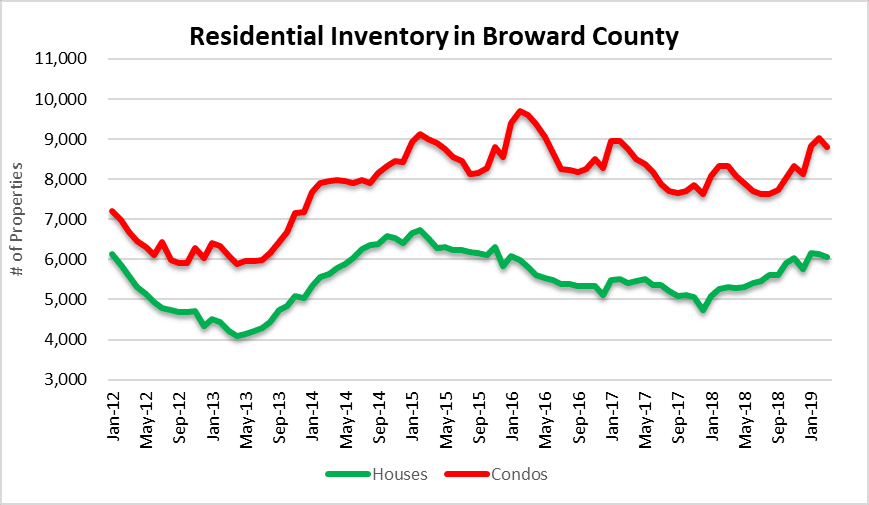
Active listings
There were 14,844 houses and condo properties available for sale in the Greater Fort Lauderdale / Broward County area during the month of March. That figure is down slightly from 15,164 in February. The number of houses for sale was 6,051 and there were 8,793 condos on the market. The higher deal volume took a bite out of the existing inventory, but it will most likely rise again soon. Properties are remaining on the market longer (or going stale) to put it simply.
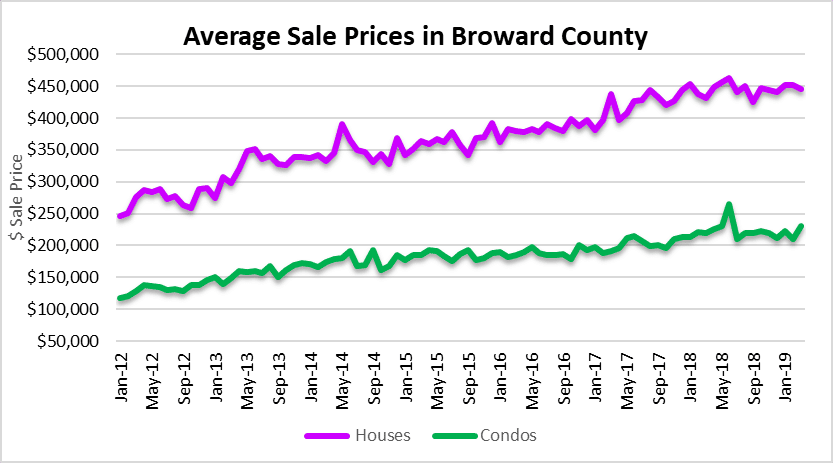
Sale Prices in the Fort Lauderdale area
Keep in mind that this chart is just through the month of March. We still believe that prices peaked last June (2018), so we will continue to compare current prices to the peak until the data shows otherwise. The average sale price of a house was $445,033 in March, still down 4% since June. The average sale price of a condo was $231,260 in March, down 13% since June. The pace of sales needs to climb and inventory must drop if you want prices to remain at current levels.
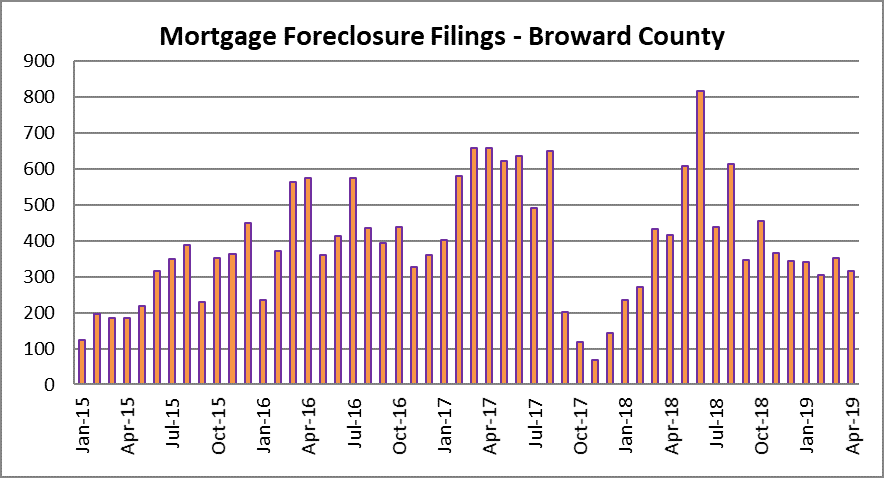
Foreclosure Activity
What’s a market update without a chart of new foreclosure filings? We have been charting this data throughout the housing “recovery” and continue to see plenty of filings. Here is a chart of the filings for single-family homes and condo properties in the Greater Fort Lauderdale area. We have also included the filing data from January 2015 through April 2019 for comparison purposes. You will nice a large spike in the spring/summer months of 2018. We will see if that happens again this year, but so far the average monthly filings are down from 2018.
| Annual | Monthly | Change | |
| 2015 | 3,356 | 280 | |
| 2016 | 5,044 | 420 | 50% |
| 2017 | 5,228 | 436 | 4% |
| 2018 | 5,341 | 445 | 2% |
| 2019 | 1,342 | 336 | -25% |