Blog
The Tide is High
With the high tides across coastal Florida this week, an appropriate tune to play along with our charts is “The Tide is High” originally written back in 1967 by a Jamaican singer named John Holt and his band The Paragons. It was later released by Blondie in 1980. Here is that version if you want to listen along. Now it makes total sense why you may hear reggae bands play this song from time to time!
The tide is high but I’m holdin’ on
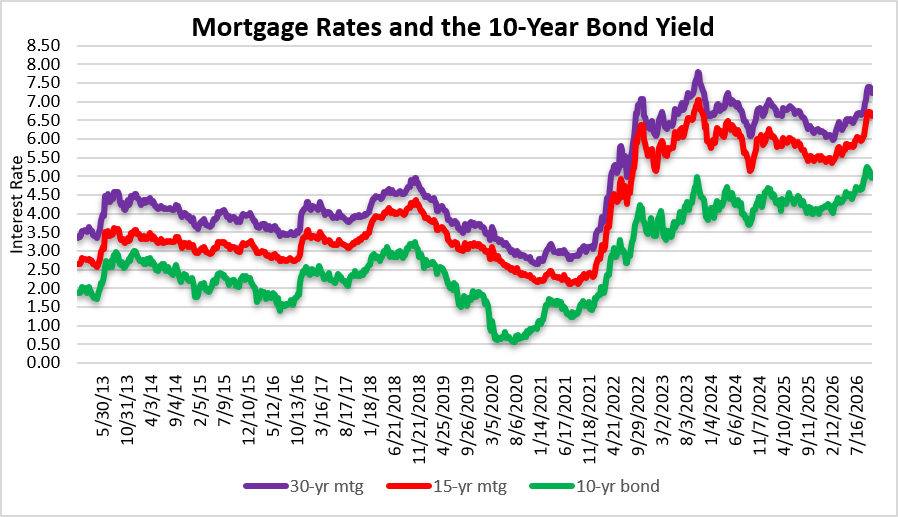
Let’s take a look at some charts. For starters, mortgage rates remain elevated. All of that manipulation of rates (especially during the 2020-2022 period) comes with a price. With mortgage rates in the 7’s, real estate transaction volume could remain under pressure for awhile. The ultra-luxury market may be immune, but anyone else who calculates a monthly payment into a budget may be reluctant to buy.
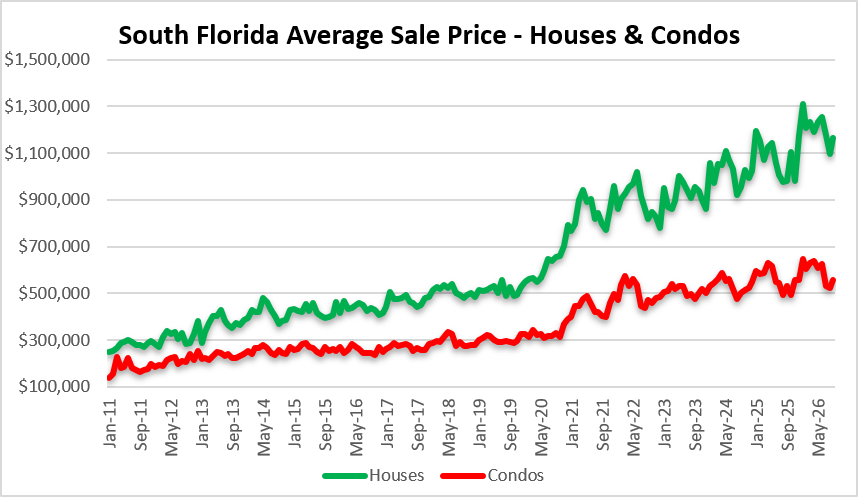
How about average sale prices? During the month of September the average selling price for single-family homes in the tri-county area was $1,165,208. Look at the 2020-2021 breakout in prices! The jump in single-family homes was bananas. The average selling price of condo properties was $557,354 in September. That segment has been trending sideways for awhile. Condo units in older buildings will remain under pressure and when older units enter the market, they should keep a lid on average sale prices.
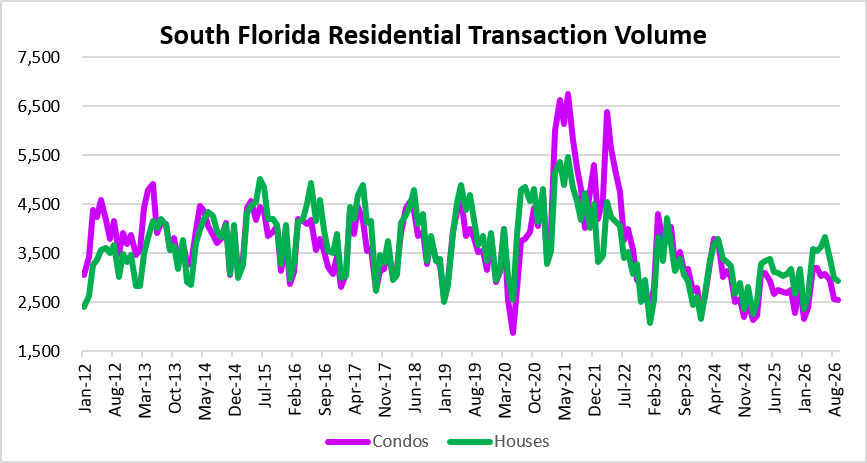
There were 2,542 condo sales and 2,930 single-family home sales during the month of September. You will notice the seasonal spikes in the chart below. What’s interesting is how so many people rushed to buy South Florida condos during COVID. Do you think they are regretting it now? Will transaction volume increase again during the spring months of 2027?
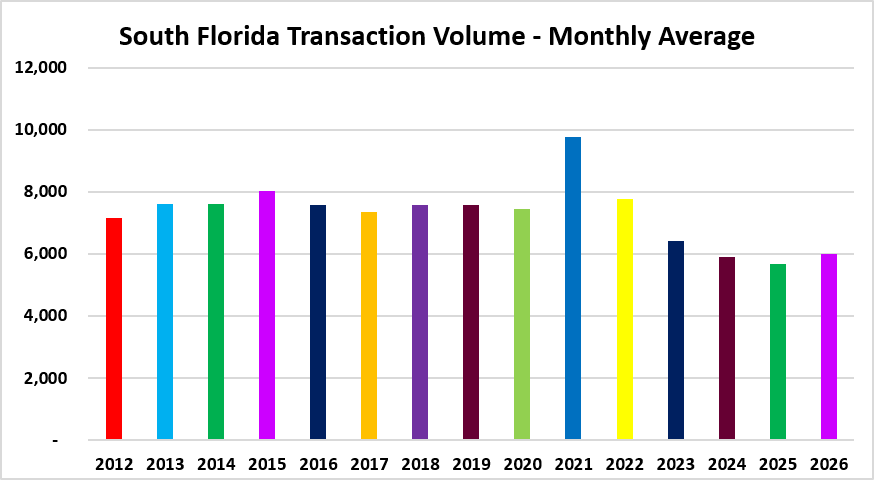
Average monthly sales for houses and condos across South Florida. Obviously 2021 was an outlier. During 2026, so far the monthly average transaction volume in South Florida is 5,997.
| Annual | Monthly Avg | |
| 2012 | 86,001 | 7,167 |
| 2013 | 91,180 | 7,598 |
| 2014 | 91,239 | 7,603 |
| 2015 | 96,411 | 8,034 |
| 2016 | 90,974 | 7,581 |
| 2017 | 88,227 | 7,352 |
| 2018 | 90,870 | 7,573 |
| 2019 | 90,864 | 7,572 |
| 2020 | 89,348 | 7,446 |
| 2021 | 117,264 | 9,772 |
| 2022 | 93,038 | 7,753 |
| 2023 | 76,785 | 6,399 |
| 2024 | 70,935 | 5,911 |
| 2025 | 68,233 | 5,686 |
| 2026 | 53,970 | 5,997 |
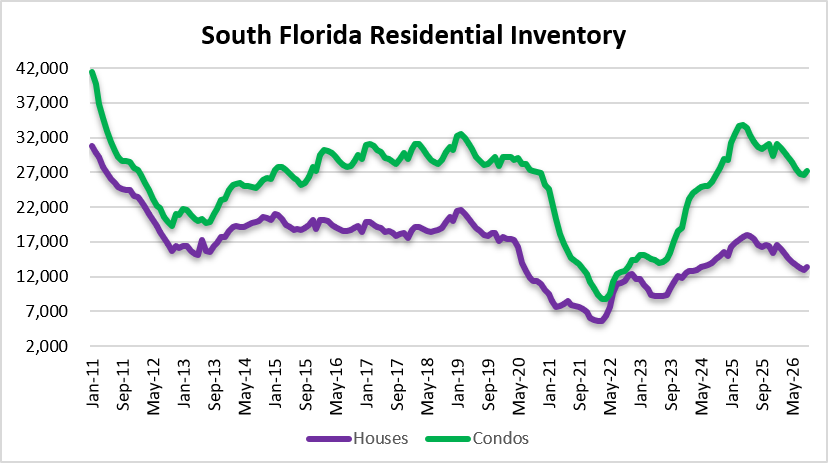
How about real estate inventory across Miami-Dade, Broward and Palm Beach? There were 13,368 houses and 27,146 condos available for sale in September. It looks like activity has moderated for now. If deal volume remains slow, you may see an inventory build in early 2027.
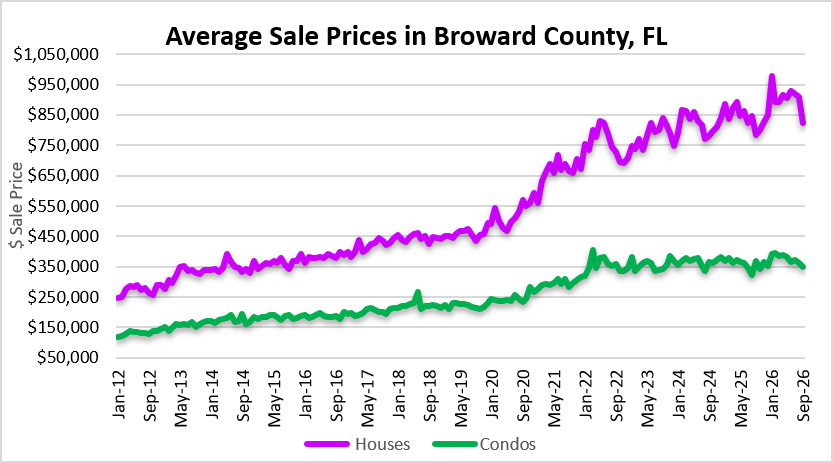
Bonus chart – For anyone in town for the Boat Show, here is a snapshot of sale prices across Greater Fort Lauderdale / Broward County area.
In keeping with the high tide theme, the king tides are paying us a visit this week. If you plan to be out in the coastal areas looking at real estate, you should probably pack your rubber boots. Coastal flooding, sunny day flooding, king tide flooding, call it what you want. This will be a recurring issue for plenty of South Florida neighborhoods.
This market outlook covers real estate activity in Miami-Dade, Broward and Palm Beach County, Florida. Here are just a few of the cities in each of these three markets:
- Miami-Dade – Aventura, Coral Gables, Miami Beach, Hialeah, Sunny Isles Beach, North Miami, Homestead, Doral, Miami Lakes, Downtown Miami, Brickell and Key Biscayne.
- Broward – Fort Lauderdale, Pompano Beach, Deerfield Beach, Hollywood, Hallandale, Weston, Parkland, Wilton Manors, Oakland Park, Plantation, Cooper City, Davie, Coral Springs, Sea Ranch Lakes, Lauderdale by the Sea and Lighthouse Point.
- Palm Beach – Delray Beach, Highland Beach, Jupiter, Palm Beach Island, Boynton Beach, Boca Raton, Highland Beach, Palm Beach Gardens, West Palm Beach, Wellington and Lake Worth.