Blog
Spot the price gains

Now that we all know the single-family home market is on a tear lately, can you spot the price gains across South Florida? By looking at the chart of the sale prices, it sure looks like Palm Beach County is dragging the average sale prices higher. Here is a breakdown:
- Palm Beach – $737,848
- Miami-Dade – $678,706
- Broward – $511,102
These are still some big numbers across the board! The cash buyers might not care, but at some point the leveraged buyers have to realize that they are overpaying if the music stops on this ride. As mortgage credit tightens, the pool of buyers may finally begin to shrink and prices will start to drop. The Greater Fort Lauderdale / Broward County market is in last place when it comes to price gains, so let’s take a look at the numbers for that area.
Houses and Condos in Fort Lauderdale
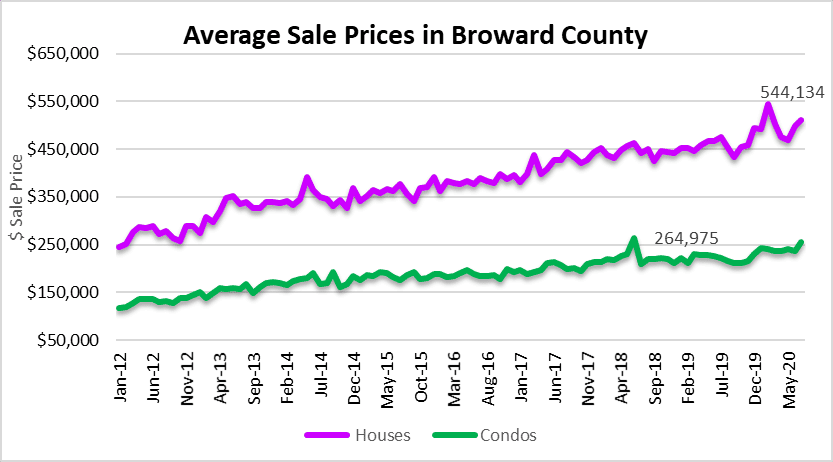
You will notice form the above chart that most recent high set in average sale price was $544,134 in February of this year. In July, the prices rebounded to $511,102, so we will see if we can revisit or take out that prior high. Usually it will just take a few closed sales in the ultra-luxury home market to drag the average higher and that market has been performing well. The prior high in condo prices was $264,975 in June of 2018. In July the average sale price of a condo was $256,546, so we aren’t too far from the prior high set a few years back. The condo market has been a laggard in sales volume and price gains lately, so it’s worth keeping an eye on if it continues to under perform.
Transaction volume in Fort Lauderdale
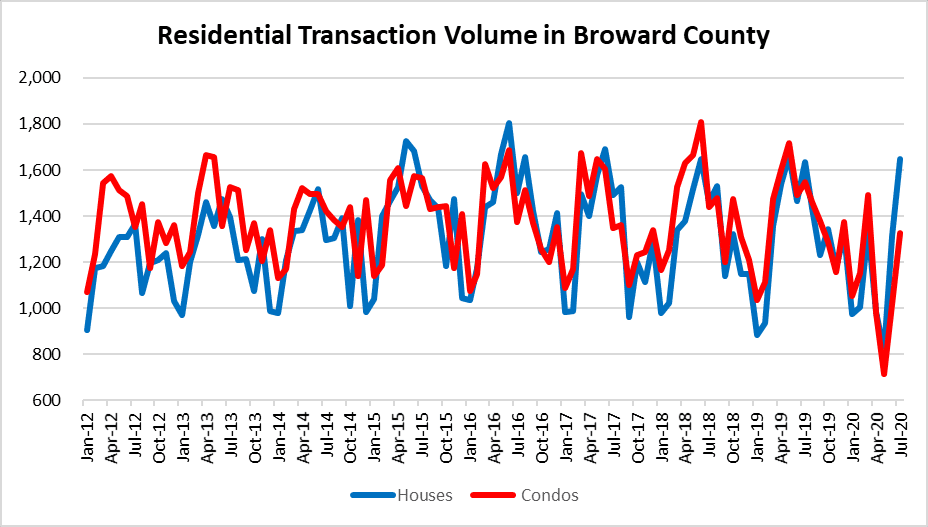
Sales volume bounced back in a big way last month. There were 1,646 closed sales in the single-family home market and 1,326 closed sales in the condo market across Broward County. You will notice that April-June is typically an active time for real estate purchases and it’s possible that the seasonal demand was pushed into July due to COVID-19. This next chart illustrates how sales volume remains lower than prior years on average.
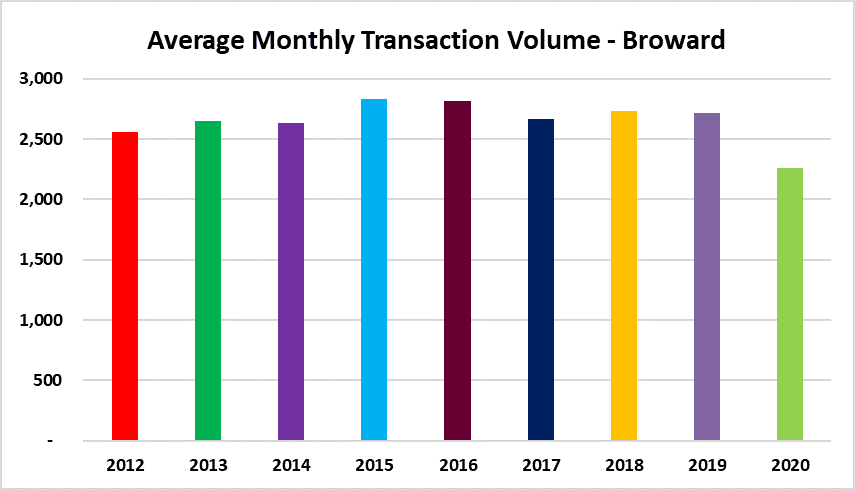
Here is a look back to 2012:
| Average Monthly Transactions | |||
| 2012 | 2,555 | ||
| 2013 | 2,647 | ||
| 2014 | 2,636 | ||
| 2015 | 2,829 | ||
| 2016 | 2,815 | ||
| 2017 | 2,668 | ||
| 2018 | 2,733 | ||
| 2019 | 2,717 | ||
| 2020 | 2,261 | ||
Residential Inventory in Fort Lauderdale area
The perfect storm of historically low mortgage rates and low inventory is helping to lift prices in the area. In July there were only 3,725 houses listed for sale across Broward County. This chart dates back to 2012 and the closest we have seen was 4,089 houses on the market back in April 2013. Just to add some perspective, that was after foreclosures were halted during the last bust and inventory dried-up. The number of condos on the market was at 11,680 in July, so that’s another reason prices haven’t climbed in that segment.

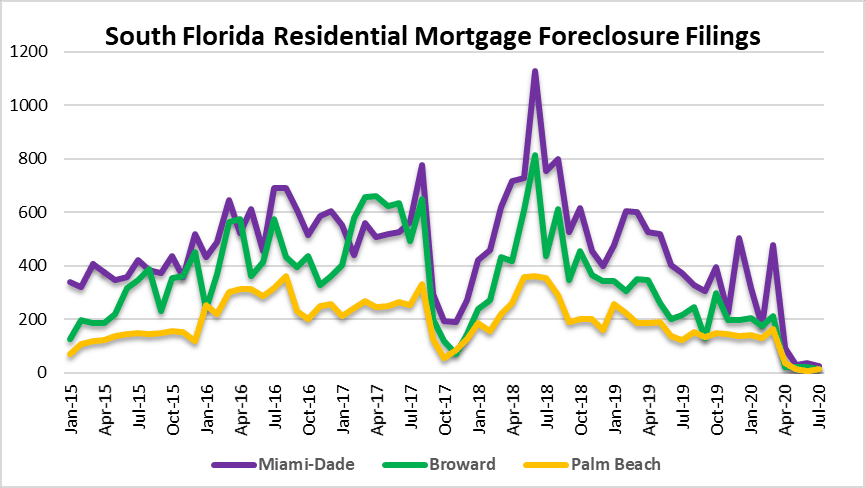
Foreclosure activity in South Florida
Foreclosures have been halted due to the COVID-19 pandemic, so the chart of new filings has flat-lined. If they resume in the fourth quarter, this chart will show some activity again, The previous spikes in the chart are after moratoriums were lifted due to hurricanes. The largest spike was in 2018 after forecloure filings were halted after Hurricane Irma in 2017.